| Home | Energy | Nuclear | Electricity | Climate Change | Lighting Control | Contacts | Links |
|---|
OBJECT:
The object of this web site is to present climate change related information in a manner that is understandable, incontestable and suitable for forming the basis of public policy with respect to energy and environmental matters. The technical information is at a level that undergraduate physics students should be able to comprehend.
PUBLIC POLICY:
The practical public policies that must be implemented to prevent further global warming are presented. These policies are dictated by the laws of physics. There is no room for political denial or compromise.
EXECUTIVE SUMMARY:
The historical record indicates that during the period 950 AD to 1100 AD (the medieval warm period) the average temperature in the North Atlantic was significantly warmer than during the period 1500 AD to 1900 AD. During the medieval warm period Vikings colonized Greenland and Newfoundland. About 1200 AD the North Atlantic climate cooled and the occupants of these settlements either abandoned them or perished.
We are uncertain today as to the exact physical mechanism that caused the medieval warm period. We strongly suspect that this warming was a result of a temporary decrease in the North Atlantic albedo (solar reflectivity). This change in albedo could have been caused by a change in atmospheric chemistry, by a change in the sun's emission of ionizing radiation or by a change in the Earth's or Sun's magnetic field. We have seen in the last few decades that a small increase in CFC's in the atmosphere has a profound effect on upper atmosphere ozone concentration which in turn affects the Earth's albedo at ultra-violet wavelengths, especially in polar regions. We have also seen significant movement of the Earth's magnetic poles.
During the 20th century there were new causes of planetary warming which have continued into the 21st century. This warming is caused by an increase in the atmospheric carbon dioxide concentration and by ongoing release of heat from stored chemical and nuclear energy.
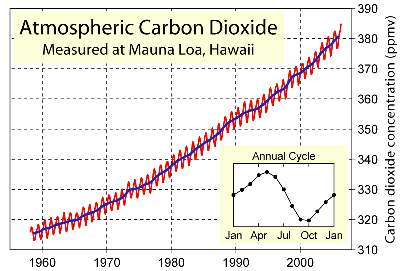
Accurate measurements of the atmospheric carbon dioxide concentration have been made at Mauna Loa, Hawaii by the Scripps Institution of Oceanography, NOAA Earth System Research Laboratory and others since 1958. These measurements are graphically presented below.
There has been an increase in average atmospheric carbon dioxide concentration from 315.97 ppmv in 1959 to 396.48 ppmv in 2013.
If the present trend continues the atmospheric carbon dioxide concentration measured at Mauna Loa, in the middle of the Pacific Ocean, will reach 560 ppmv, twice its historic level of 280 ppmv, before the year 2078. In major metropolitan areas, where there is ongoing local CO2 emission, the average CO2 concentration is well over 400 ppmv and is continuing to rise.
Today carbon dioxide (CO2) related warming is a life threatening problem, not because most people are not aware of it, but because most people in industrialized countries have no concept of the magnitude of its consequences or of the amount by which consumption of fossil carbon must be reduced in order to prevent these consequences causing massive human mortality.
Accumulation of excess carbon dioxide and other greenhouse gases in the Earth's atmosphere reduces the Earth's infrared emissivity. The reduction in infrared emissivity causes an increase in the atmospheric temperature over dry land, causes net heat absorption by the oceans, causes increased evaporation per unit area from irrigated farm land and causes melting of otherwise permanent ice.
Net heat absorption by lakes and oceans causes a gradual increase in open water surface temperature. An increase in open water surface temperature causes an increase in the average atmospheric water vapor concentration, as shown by the following graph of saturated water vapor density as a function of temperature.

Since water vapor is also a greenhouse gas, the Earth's infrared emissivity is further reduced by the increase in average atmospheric water vapor concentration. The thermal effects of this additional reduction in emissivity are partially cancelled by formation of additional cloud cover, which slightly increases the Earth's reflectivity (albedo) in the solar spectrum. However, the net effect of the increase in average atmospheric water vapor concentration is to amplify the increase in atmospheric temperature over dry land that is directly caused by non-aqueous greenhouse gases. The total green house gas induced temperature increase over dry land is known as "global warming".
The green house gas induced reduction in local emissivity causes heat absorption that increases the moisture evaporation rate per unit of cultivated land area. Since the supply of fresh water for crop irrigation is usually limited by average rainfall, which does not increase with atmospheric CO2 concentration, an increase in evaporation rate per unit of cultivated land area causes a corresponding decrease in the cultivated land area. However, the number of received solar photons for performing photosynthesis per unit of cultivated land area decreases due to additional cloud cover, so the net effect of an increase in atmospheric CO2 concentration is a decrease in agricultural output due to reductions in both the cultivated land area and the number of received solar photons per unit area per unit time.
The problem of reduced agricultural output is further aggravated because the supply of fresh water for summer irrigation is diminished due to loss of mountain snowpacks and due to increased evaporation from open irrigation reservoirs. The resulting food shortage is further compounded by an increasing human population and by increasing use of agricultural products for biofuels as well as for food. Relatively few people in the industrialized countries realize that reliance on liquid hydrocarbon fuels will soon lead to world wide starvation.
Returning the average atmospheric carbon dioxide concentration to its 1990 value of 354.35 ppmv requires an immediate decrease in the world wide fossil carbon dioxide emission rate to about 47.8% of the 2004 world wide fossil carbon dioxide emission rate. However, it is unreasonable to expect countries with below average per capita fossil carbon dioxide emission rates to achieve significant further fossil CO2 emission rate reductions when Canada and the USA have per capita fossil carbon dioxide emission rates that are about four times the per capita world average. The most significant fossil carbon dioxide emission reductions must come from the industrialized countries such as Canada and the USA. In order to return to 1990 atmospheric conditions the per capita fossil carbon dioxide emission rates from these two countries must be reduced nine fold to less than 11% of their 2004 fossil carbon dioxide emission rates.
Achieving the required world wide fossil carbon dioxide emission rate reductions will require abandonment of fossil carbon as a primary energy source and will require major human population reductions either by planned birth control, or by starvation, war and pestilence.
Very few governments are taking this issue seriously. In most cases politicians neither grasp the underlying physics nor the full consequences of failing to promptly make the public policy changes that are necessary to avert a global warming disaster. The existing political responses are at best half measures that may temporarily deceive the public but will not solve the problem. The catastrophic consequences of these inadequate political responses will be born by our children.
Lack of understanding of the science of global warming is no excuse. Our neighbouring planet Venus has an atmosphere that is almost entirely composed of carbon dioxide. The experimentally measured surface temperature on Venus is about 400 degrees C higher than it would be if Venus had a nitrogen/oxygen atmosphere similar to Earth. The influence of atmospheric carbon dioxide on surface temperature is unmistakeable, even to those who have no training in physics. For those who understand physics, Venus demonstartes that carbon dioxide has absorption sidebands that extend right across the thermal infrared spectrum.
This web site presents the incontestable physical and mathematical relationships connecting solar irradiance, albedo, thermal emission, infrared gaseous absorption, atmospheric temperature, greenhouse effect, local warming and net heat capture along with related data gathered from outside air temperature records, laboratory, satelite and deep space probe instruments. The increase in ground level atmospheric temperature over dry land directly caused by an increase in atmospheric carbon dioxide concentration is quantified.
GLOBAL WARMING:
Global warming is the increase in average atmospheric temperature over dry land that results from a world wide increase in average atmospheric greenhouse gas concentration, a decrease in planetary albedo or an ongoing release of stored chemical, nuclear or thermal energy. The increase in carbon dioxide concentration that is responsible for much of global warming is usually measured at a remote place such as Mauna Loa, Hawaii that is far from any significant man made source of carbon dioxide.
GLOBAL WARMING QUANTIFICATION:
We have sufficient data to accurately quantify global warming without use of a climate model. We know what the radiation emission versus frequency and temperature of the Earth would be with little or no greenhouse gas in the atmosphere. We know what the radiation emission versus frequency and temperature of the Earth would be with a lot of greenhouse gas in the atmosphere. We know what the actual radiation emission versus frequency of the Earth was in 1996 and we know the temperature and greenhouse gas concentration that prevailed in 1996. By applying the principles of variational calculus we can calculate the radiation and temperature effects of changing the amount of greenhouse gas in the atmosphere by an amount comparable to the atmospheric greenhouse gas concentration in 1996. We can do a similar mathementical trick with respect to the reflectivity of the Earth. Hence we can calculate the amount of global warming that will occur due to doubling the atmospheric CO2 concentration. It is not necessary to have a detailed understanding of the physical processes involved to do this calculation because we already have hard recorded data which tells us the overall effect of the 1996 atmospheric concentration of greenhouse gases.
The huge advantage of this methodology is that it avoids the use of a climate model. Climate models involve assumptions and have difficulty accurately representing reality. Application of the principles of variational calculus essentially assumes that small changes in the atmospheric greenhouse gas concentration result in only small changes in the radiation emission profile. These small changes can be accurately interpolated from the known data. This methodology is a very powerful mathematical technique which has been successfully applied in other branches of physics.
It is shown that a change in atmospheric greenhouse gas concentration between time a and time b causes an atmospheric emission temperature ratio (Tab / Taa) given by:
(Tab / Taa) = [(Fta (1 - Frb)) / ((Ftb (1 - Fra))]^.25
where:
Taa = emission temperature in degrees K at time a;
Tab = emission temperature in degrees K at time b;
Fta = infrared emissivity at time a;
Ftb = infrared emissivity at time b;
Fra = albedo (solar reflectivity) at time a;
Frb = albedo (solar reflectivity) at time b;
where the infrared emissivity Ft is a parameter that can be measured by a spacecraft borne instrument known as a Thermal Emission Spectrometer and where the albedo Fr is a parameter that can be determined via measurement of reflected solar power.
Numerical evaluation of this equation indicates that doubling the average atmospheric carbon dioxide concentration while holding the average atmospheric water vapor concentration constant and Fr constant causes an atmospheric emission temperature increase of about 3.15 degrees C.
This temperature increase is slightly amplified by an accompanying increase in average atmospheric water vapor concentration. The average atmospheric water vapor concentration is dependent on the average surface temperature of open water. When the atmospheric carbon dioxide concentration is doubled the accompanying increase in atmospheric water vapor concentration for an average open water temperature of 15 degree C causes a further 0.865 degree K atmospheric emission temperature increase provided that the planetary albedo Fr remains constant. The resulting total temperature increase caused by doubling the atmospheric carbon dioxide concentration is:
3.15 K + 0.865 degrees K = 4.015 K.
The surface temperatures of Lake Ontario, Lake Erie and Lake Huron have all been further increased by use of these lakes as heat sinks for nuclear and fossil fueled thermal electric generating stations. The resulting increase in open water surface temperature accounts for part of the 2.44 degree C average temperature increase from 1965 to 2005 recorded by Environment Canada at the Toronto International Airport. During this 40 year period the atmospheric carbon dioxide concentration measured at Mauna Loa, Hawaii increased from 318.71 ppmv to 377.48 ppmv. Due to local sources of CO2, the increase in atmospheric CO2 concentration over southern Ontario was significantly larger.
It is shown that a decrease in local albedo will also cause warming. The large average temperature increase experienced in northern Canada in recent years is in part due to a decrease in local albedo related to melting of snow and floating ice. The local albedo in polar regions has been further reduced by a decrease in upper atmosphere ozone as a result of pollution by Chloro-Fluoro-Carbons (CFCs).
At this time this author is not aware of any readily available data that can be easily used to quantify the change in the Earth's planetary albedo in the ultra-violet range. Most of the astronomical planetary albedo measurements were done in the visible range. There have been measurements of atmospheric ozone concentration vs time and position, but converting those measurements into a quantified change in planetary albedo is a challenge.
It is further shown that if the future mass flow rate to the atmosphere Fc of carbon dioxide generated by combustion of fossil fuels is held constant then the ultimate world wide average carbon dioxide concentration in the atmosphere (CO2) measured far from any CO2 source is given by:
(CO2) = (CO2)o [((Fc To) / Ma) + 1]
where:
(CO2)o = historic atmospheric carbon dioxide concentration = 280 ppmv
Fc = mass flow rate of carbon dioxide into the atmosphere from combustion of fossil fuels
To = exponential decay time constant of excess carbon dioxide in the atmosphere
Ma = historic mass of carbon dioxide in the atmosphere
Numerical evaluation of this equation using the 2004 value of Fc of:
Fc = 3.683 X 10^13 kg / year
and the calculated values:
Ma = 224.91 X 10^10 tonnes of CO2
and
To = 41 years
gives:
(CO2) = 280 ppmv [((3.683 X 10^13 kg / year X 41 years) / 224.91 X 10^13 kg) + 1]
= 468 ppmv
The local atmospheric carbon dioxide concentration near sources of carbon dioxide such as fossil fueled electricity generation stations and major cities will be substantially higher.
The value of Fc that will cause the atmospheric CO2 concentration to double from its historic value of 280 ppmv to a new value of 560 ppmv is given by:
(Fc To) / Ma = 1
or
Fc = Ma / To
= (224.91 X 10^10 tonnes CO2) / 41 years
= 5.49 X 10^10 tonnes CO2 / year
The temperature increase due to global warming is already causing major ecological changes and is causing massive human population migration away from equatorial countries. During this author's lifetime the population of Canada has doubled purely due to immigration.
Global warming also causes net heat absorption by the oceans. In near polar regions the net absorbed heat melts floating polar ice. Melting of old floating ice does not change the sea level. However, melting of the old floating ice belts around Greenland and Antarctica allows super cooled glacial discharge streams from land borne ice to flow into the ocean. Such glacial discharge streams will cause a relatively rapid rise in sea level.
It is shown on the web page titled: Ocean Instability that at the ocean temperatures that prevailed in the late 20th century the exponential decay time constant To of excess carbon dioxide in the atmosphere is about:
To = 41 years
This decay time constant will increase with increasing ocean water temperature.
The only way to mitigate the height of the resulting sea level rise is to stop use of fossil fuels now in order to allow the transient atmospheric CO2 concentration to decay before thermal runaway is established.
Geology shows that there have been various times in the past when the sea level was much higher than it is today. One of those times was 56 million years ago during the PETM when the steady state atmospheric CO2 concentration was about 700 ppm and both polar ice caps melted. Most of that increase in atmospheric CO2 concentration was due to an increase in ocean water temperature. At high ocean water temperatures atmospheric CO2 concentration reduction by biological processes and carbonate rock formation takes hundreds of thousands of years.
The analysis of the temperature increase and net heat capture rate triggered by increased atmospheric carbon dioxide concentration is based on fundamental physics with no climatic model assumptions. The incident solar radiation data was recorded from 1978 to 2007 by multiple satellites. The infrared thermal emission spectrum of the whole Earth was recorded by the NASA Mars Global Surveyor spacecraft on November 24, 1996. The average planetary albedo was obtained from astronomical observations of the moon. The ground level temperature data over the 40 year period 1965 to 2005 was obtained from Environment Canada. The atmospheric carbon dioxide concentration was obtained from measurements at Mauna Loa, Hawaii. The bicarbonate ion concentration in the oceans was obtained by conventional quantitative chemical analysis done in both the UK and the USA. Other satellite and laboratory data are presented for explanatory and confirmation purposes.
LOCAL WARMING:
Local warming is the increase in the local average atmospheric temperature over dry land that results from a local increase in atmospheric greenhouse gas concentration, a local decrease in albedo or local heat dissipation from an ongoing local release of stored chemical, gravitational, nuclear or thermal energy. In regions without ice or snow local warming tends to be greatest in proximity to carbon dioxide and heat sources such as power stations, traffic in major cities, building heating systems and major industrial processes. Proximity to stratified open water allows the average atmospheric water vapor concentration to increase with the local CO2 concentration, amplifying CO2 related warming. In polar regions there are additional local changes in the upper atmospheric ozone concentration that significantly affect albedo in the ultra violet range.
Another significant cause of a decrease in planetary albedo is desertification due to incorrect use of grassland for livestock as set out in the following video.
DESERTIFICATION
CONCLUSIONS:
The temperature increase observed in Toronto during the period 1965 to 2005 was almost entirely due to increases in the atmospheric greenhouse gas concentration and local heat dissipation within the Greater Toronto Area. There is theoretical potential for some winter warming due to change in albedo related to melting of snow and ice, but the experimental data indicates that this effect is relatively insignificant in Toronto.
The main conclusion is that fossil carbon is not a sustainable primary energy source. There is a hard limit on the human population that the Earth can sustainably support. This population limit is a strong function of both the availability of nuclear power and the future time when nuclear power displaces fossil fuels. The longer the conversion from fossil fuels to nuclear power is delayed, the lower will be the Earth's ultimate human population carrying capacity.
This web page last updated June 28, 2018.
| Home | Energy | Nuclear | Electricity | Climate Change | Lighting Control | Contacts | Links |
|---|