| Home | Lighting Control | Micro Fusion | Electricity | Climate Change | Contacts | Links |
|---|
By Charles Rhodes, Xylene Power Ltd.
HISTORICAL TEMPERATURE DATA:
Environment Canada compiles records of temperatures at various locations in Canada. Many of these locations, particularly airports, meet the "dry ground" criteria. The temperatures are recorded at hourly intervals and are published on the Internet. Environment Canada also publishes corresponding monthly mean temperatures and annual average temperatures. This data shows that urban area warming in Canada is significantly more than can reasonably be attributed to the world wide increase in atmospheric CO2 concentration.
COMPONENTS OF EXPERIMENTALLY MEASURED URBAN AREA TEMPERATURE INCREASES:
An urban area's experimentally measured long term (40 year) annual average temperature increase has a component due to world wide global warming and may have additional planetary and local warming components due to:
1. Local CO2 emissions from combustion of fossil fuels;
2. Local H2O emissions from combustion of hydrocarbon fuels;
3. Local heat emissions from combustion and nuclear processes;
4. Local increased atmospheric water vapor concentration due to use of lakes as heat sinks for thermal-electric plants;
5. Local heat dissipation by electrically powered equipment;
6. A decrease in local albedo;
7. Particulate emissions by combustion processes;
8. Changes in solar activity.
NON-AQUEOUS GLOBAL WARMING:
Precise carbon dioxide concentration measurements indicate that during the 40 year period January 1, 1965 to December 31, 2004 there was an increase in the atmospheric carbon dioxide concentration at Mauna Loa from 318.71 ppmv to 377.48 ppmv. Hence, for this period at Mauna Loa:
(CO2)2005 / (CO2)1965)
= (377.48 / 318.71)
= 1.184
This equation indicates that during the forty year period 1965 to 2005 the average atmospheric carbon dioxide concentration at Mauna Loa, Hawaii increased by 18.4%.
Recall from the Global Warming section that the rural area calculated dry ground temperature increase due to doubling of the atmospheric CO2 concentration is 2.923 C. Assume that to a first approximation world wide global warming is given by:
(Tb - Ta) = Kx ln(Cb/Ca)
where:
Tb = temperature at time b;
Ta = temperature at time a;
Kx = a constant to be determined;
Cb = atmospheric CO2 concentration at time b;
Ca = atmospheric CO2 concentration at time a.
Rearranging this equation gives:
kx = (Tb - Ta) / ln(Cb/Ca)
Numerical substitution for the case of a doubling of the atmospheric CO2 concentration gives:
Kx = (2.923 C) / ln(2)
= 4.217 C
Hence in general:
(Tb - Ta) = (4.217 C) ln(Cb/Ca)
For the 40 year period 1965 to 2005 the global warming is:
(Tb - Ta) = (4.217 C) ln(1.184)
=.712 C
The experimentally measured warming at Canadian urban locations has both global warming and local warming components.
VICTORIA:
Victoria is a city surrounded on three sides by cold ocean. The cold ocean keeps the atmospheric water vapor concentration low. Victoria is a retirement and civil service community with no heavy industry. It seldom snows in Victoria. Almost no one has air conditioning. Electricity is provided via an under-sea cable. The average albedo from year to year in Victoria is highly stable, because there is almost no snow and because the average albedo of the ocean is constant. Victoria has an airport with a reliable long term atmospheric temperature record.
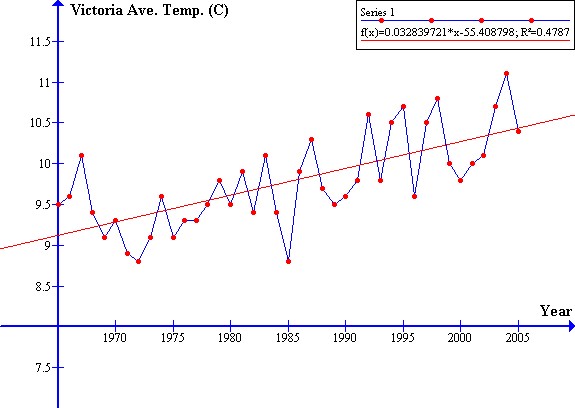
The graph below shows the average annual temperature at the Victoria International Airport over the forty year period 1965 to 2005.
This plot shows a warming at the Victoria International Airport of:
40 years X .032839721 C / year = 1.3136 degrees C
over the 40 year period 1965 to 2005.
If we assume that the high altitude atmospheric carbon dioxide concentration over Victoria is the same as the high altitude atmospheric carbon dioxide concentration over Mauna Loa, Hawaii, we find a local warming temperature increase of:
1.3136 C - .712 C = .6016 degrees C
We also made a plot of the increase in summer (June, July, August) average temperature for Victoria for the same 40 year period 1965 to 2005 as shown below:
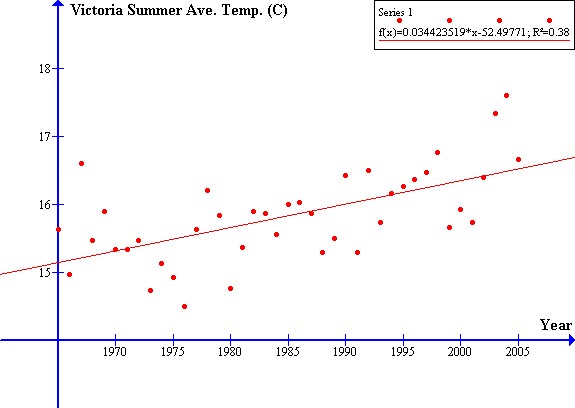
This plot shows that at the Victoria International Airport the increase in the summer average temperature over the forty year period 1965 to 2005 was:
40 years X .034423519 C / year = 1.37694 degrees C
Hence, the summer temperature increase attributed to local warming is:
1.37694 degrees C - .712 degrees C = .66494 degrees C
CALGARY:
Calgary is a city which is far from the sea and far from any other large bodies of open water.
The graph below shows the increase in average annual temperature at the Calgary International Airport over the forty year period 1965 to 2005.
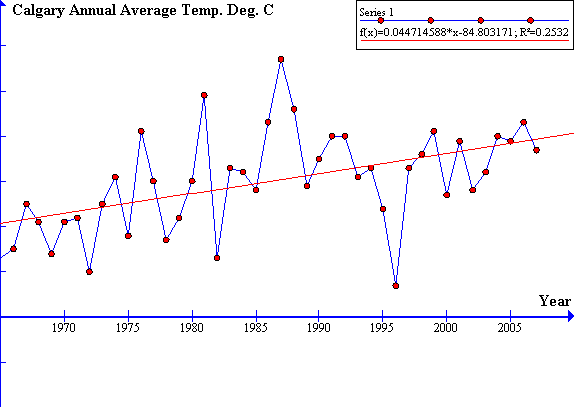
This plot shows a warming at the Calgary International Airport of:
40 years X .044714588 C / year = 1.78858 degrees C
over the 40 year period 1965 to 2005.
If we assume that the high altitude atmospheric carbon dioxide concentration of over Calgary is the same as the high altitude atmospheric carbon dioxide concentration over Mauna Loa, Hawaii, we find a local warming temperature increase of:
1.78858 C - .712 C = 1.07658 degrees C
SASKATOON:
Saskatoon is a city which is far from the sea and far from any other large bodies of open water.
The graph below shows the increase in average annual temperature at the Saskatoon International Airport over the forty year period 1965 to 2005.
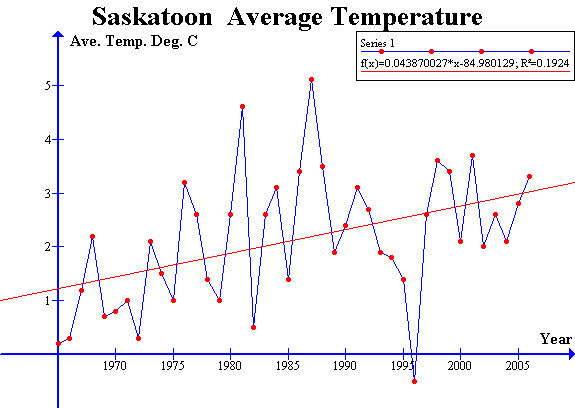
This plot shows a warming at the Saskatoon International Airport of:
40 years X .043870027 C / year = 1.7548 degrees C
over the 40 year period 1965 to 2005.
If we assume that the high altitude atmospheric carbon dioxide concentration of over Saskatoon is the same as the high altitude atmospheric carbon dioxide concentration over Mauna Loa, Hawaii, we find a local warming temperature increase of:
1.7548 C - .712 C = 1.0428 degrees C.
TORONTO:
A graph of the annual average temperature at Toronto Pearson International Airport for the 40 year period 1965 to 2005 is shown below:
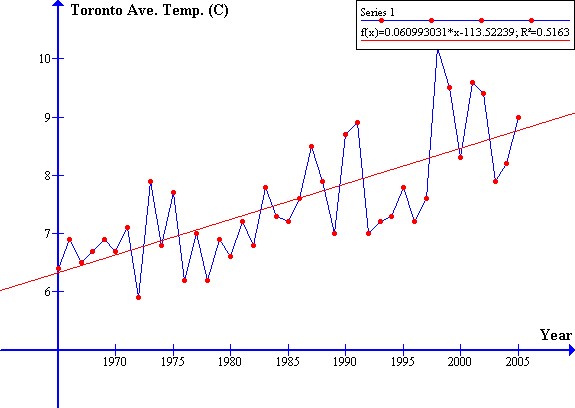
This graph shows that over the 40 year period 1965 to 2005 there was an increase in annual average temperature of about:
40 years X .060993031 C / year = 2.4397 degrees C.
If we assume that the high altitude atmospheric carbon dioxide concentration over Toronto is the same as over Mauna Loa, Hawaii then we find a local warming temperature increase of:
2.4397 C - .712 C = 1.7277 degrees C
A question that immediately arises is whether part of the relatively large local warming observed at Toronto is due to a change in local albedo related to melting of snow or ice.
Toronto never has snow in the summer months of June, July and August. Thus a change in albedo due to melting of snow will not affect the average temperatures in the summer months of June, July and August. A plot of summer average temperature versus year for Toronto is shown below:
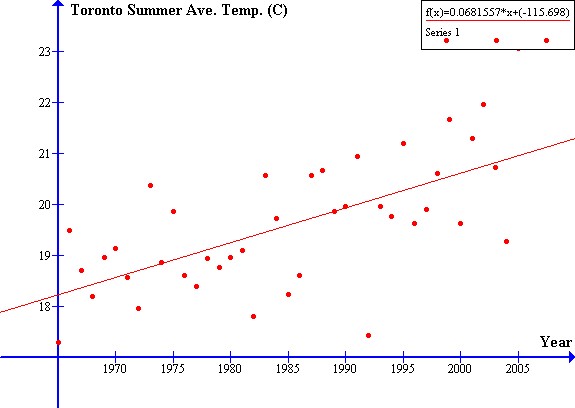
This plot shows an increase in average summer temperature over the 40 year period 1965 to 2005 of:
40 years X .0681557 C / year = 2.726 degrees C,
indicating a summer local warming of:
2.726 C - .712 C = 2.014 C
The summer average temperature increase is more than the annual average temperature increase. From this data we can conclude that a decrease in winter local albedo Fr does not significantly contribute to the local warming in Toronto.
The explanation for the high increase in local warming at Toronto is that during the last 40 years the lake water surface temperature around Toronto has increased substantially raising the atmospheric water vapor concentration. Toronto is surrounded by Lake Ontario, Lake Erie, Lake Huron and Lake Simcoe, all of which may contribute to the relatively high atmospheric water vapor concentration in Toronto, particularly in the summer. The lake surface temperature warming has been aggravated by use of these lakes as heat sinks for a multiplicity of large nuclear, natural gas and coal fuelled thermal-electric generating stations.
In the Carbon Dioxide section we find that the ocean is the main sink for excess carbon dioxide in the atmosphere. Hence Toronto, an inland city, will have a higher atmospheric carbon dioxide concentration than Victoria which is by the ocean. Also Victoria will have a higher atmospheric carbon dioxide concentration than Mauna Loa, Hawaii, which is in the middle of the Pacific Ocean with no significant nearby sources of man made carbon dioxide. It is difficult to distinguish the temperature effects of the gradient in CO2 concentration along the Earth's surface from the temperature effects of the gradient in atmospheric water vapor concentration along the Earth's surface.
CHANGE IN LOCAL ALBEDO:
A change in local albedo due to melting of floating ice explains part of the rapid warming in northern Canada, particularly adjacent to Hudson Bay and the Arctic Ocean. However, this effect is negligible in both Toronto and Victoria.
CHANGE IN PLANETARY ALBEDO:
Astronomical measurements of planetary albedo made in 1999-2000 suggest that there was a slight diminishment in the earth's planetary albedo measured in 1999-2000 as compared to the earth's planetary albedo measured by the same technique in 1994-1995. This diminishment in planetary albedo is expected due to melting of polar ice. It is possible that this small decrease in planetary albedo is contributing to the temperature increase in Canadian cities.
OTHER GREENHOUSE GASES:
Recall from the Infrared Absorption section that both methane and nitrous oxide have absorption bands in the frequency range 1200 cm^-1 to 1400 cm^-1. The Mars Global Surveyor thermal emission spectrum of the Earth shows that only a relatively small amount of additional global warming can be caused by increases in the atmospheric concentrations of methane and nitrous oxide. On plots of ground level temperature versus time the effects of these gases are indistinguishable from the effect of carbon dioxide.
VIBRATIONAL ABSORPTION BY H2CO3:
One possible physical explanation for part of the increased warming is increased
Carbonic acid production causing vibrational absorption at 1307 cm^-1 and 1508 cm^-1 by the C-OH chemical bond of H2CO3. This molecule only exists in the presence of water and takes the form:
O=C=(OH)2
These absorption bands are mixed up with the methane, nitrous oxide and water absorption spectra. In the presence of fine water droplets (clouds) this absorption will increase with increasing carbon dioxide concentration. This mechanism could account for a small part of the extra warming.
CLOUD ALTITUDE:
The above graph showing the annual average temperature versus year at the Toronto International Airport shows that in 1996 the average ground level temperature Tag was:
Tag = .060993031 (1996) - 113.52239
= 8.22 degrees C
= 8.22 + 273.16
= 281.38 degrees K
Let Th be the average difference between the ground level temperature Tag and the cloud level temperature Ta. The data from the thermal emission spectrometer on the Mars Global Surveyor spacecraft indicates that in November 1996 the observed value of Ta was about 270 K. By definition:
Th = Tag - Ta
= 281.38 K - 270 K
= 11.38 K
If we assume a lower atmosphere temperature decrease of 2.0 degrees K per 1000 feet of altitude, we can conclude that on November 23, 1996, at the time of the Mars Global Surveyor measurement of the earth's transmission spectrum, the average altitude of dense cloud was about:
(11.38 K / 2.0 K) X 1000 feet = 5690 feet. This average cloud altitude seems reasonable. The data appears to be consistent.
TABLE OF 1965 TO 2005 (40 YEAR) ANNUAL AVERAGE TEMPERATURE INCREASES:
| LOCATION | TEMPERATURE INCREASE |
|---|---|
| World Wide | 0.712 degrees C |
| Victoria | 1.3136 degrees C |
| Calgary | 1.78858 degrees C |
| Saskatoon | 1.7548 degrees C |
| Toronto | 2.4397 degrees C |
SUMMARY:
The experimentally observed 40 year annual average temperature increases in Canada are significantly more than can be explained purely by CO2 triggered Global Warming.
It appears that the 40 year annual average temperature increases measured at Canadian urban locations are also significantly affected by mechanisms that cause increases in Local Warming.
It is also important to acknowledge that there were historical warm periods, such as the medieval warm period between 800 AD and 1000 AD, that were not caused by an increase in atmospheric CO2 concentration. It is possible that during the aforementioned 40 year period there was a small decrease in planetary albedo. Such an albedo decrease is expected as a result of melting of polar ice.
This web page last updated July 18, 2009
| Home | Lighting Control | Micro Fusion | Electricity | Climate Change | Contacts | Links |
|---|