Figure 1 - Earth From Space Apollo 17 Dec. 1972
| Home | Energy Physics | Nuclear Power | Electricity | Climate Change | Lighting Control | Contacts | Links |
|---|
XYLENE POWER LTD.
WEB PAGE SECTION HEADINGS
INTRODUCTION
BOND ALBEDO Fr
EFFECT ON EMISSION TEMPERATURE
PHYSICAL EXPLANATION
CALCULATION OF Fr
CALCULATION OF Frc
CALCULATION OF Frw
CHANGE IN Fr ACCOMPANYING MELTING OF POLAR ICE
STATE COMPARISON
QUANTIFICATION OF ABSORBED SOLAR RADIATION
ANALYTIC REPRESENTATION OF Fr:
DERIVATIVE PROPERTIES
FIND {d[(1 - Fr) / Ft] / dT|T = To}
FIND {d[(1 - Fr) / Ft] / dT|T = Tr}
NUMERICAL EVALUATION OF Kf
INFRARED ENERGY EMISSION
PHOTON ENERGY LIBERATED BY LATENT HEAT OF FUSION OF WATER
CONSERVATION OF ENERGY
TWO STABLE STATES
NUMERICAL EVALUATION
SPECIAL CASES
ESCAPE FROM THE STABLE WARM STATE:
WARM STATE TO COOL STATE TRANSITION:
ROLE OF MALINKIVICH CYCLES:
INJECTION OF CO2 BY COMBUSTION OF FOSSIL FUELS:
GRAPHICAL PORTRAYAL OF THE EARTH'S CLIMATE AND CLIMATE CHANGE STATUS
STEADY STATE CONDITIONS
STABILITY CRITERIA
CRITERIA FOR THE EXISTENCE OF TWO LOCALLY STABLE EMISSION TEMPERATURE STATES
NON-STEADY STATE CONDITIONS
THERMAL RUNAWAY
THERMAL RUNAWAY MECHANISM
PARAMETER VALUES
FIND [(Pa As) / (Ho Ac)]
RATE OF ENTHALPY GAIN BY THE OCEANS
OCEAN VOLUME
RATE OF AVERAGE OCEAN TEMPERATURE RISE
WATER
SUMMARY
CARBON STORAGE CYCLE
THERMAL RUNAWAY DANGER
THERMAL RUNAWAY AVOIDANCE
PREVIOUS THERMAL RUNAWAY
PLANETARY BOND ALBEDO MONITORING
THERMAL RUNAWAY
RISK
EFECT OF CO2 INJECTION
WARM STATE TO COOL STATE TRANSITION
EARTH CLIMATE STATUS
DETERMINATION OF Ft
DATA ANALYSIS
???
LOW TEMPERATUREs
GRAPHICAL SOLUTION FOR T
ANALYTIC REPRESENTATION OF Fr
DETERMINATION OF Tw:
PRE-INDUSTRIAL, PRESENT AND FUTURE GRAPHS
CO2 PRESSURE DEPENDENCE OF Ft
FIND DEPENDENCE OF Ft ON CO2 CONCENTRATION
DATA ANALYSIS
???
FIND Ftc = PRE-INDUSTRIAL VALUE OF Ft
PREINDUSTRIAL VALUES
FIND Ftd - 2014 VALUE OF Ft
FIND THE VALUE OF [(1 - Fr) / Ft] AT COMMENCEMENT OF THERMAL RUNAWAY
DETERMINATION OF Tr
FIND VALUE OF [(1- Fr)] / Ft] REQUIRED TO RECOVER FROM THERMAL RUNAWAY
GRAPH DISCUSSION REVIEW
THE TREND
THERMAL RUNAWAY THRESHOLD TEMPERATURE Tr
FEEDBACK IN THERMAL RUNAWAY
HALTING THERMAL RUNAWAY
CONSEQUENCE OF WARM STATE ON GROUND LEVEL TEMPERATURE
EMAIL EXCERPT
PROGNOSIS
INTRODUCTION:
The geologic record shows a pattern of periodic ice ages at intervals of about 10,000 years, extreme galciations at intervals of about 100,0000 years and extreme hot temperatures at intervals greater than 50 million years. Hence planet Earth's ocean and atmosphere have multiple semi-stable temperature states, a "cold" state, a "cool" state, a "warm" state and a "hot" state. In the "cold" state Earth is heavily glaciated. In the "cool" state Earth has two polar ice caps and the dominant source of emitted infrared radiation is latent heat of fusion released by freezing of liquid water droplets in clouds. In the "cool" state the ocean surface temperature is low and the atmospheric CO2 concentration falls to about 220 ppmV. Various plant species at higher altitudes die for lack of sufficient CO2 which changes the local albedo and which also releases wind blown dust. Deposition of this dust on the north polar ice cap reduces the local albedo which in turn triggers ice melting.
In the "warm" state the north polar ice cap melts and the atmospheric CO2 concentration naturally rises to about 300 ppmv. However, the south polar ice cap remains. Most historical ice ages involved natural transitions between the "cool" state and the "warm" state that were caused by Milankovitch Cycles and accompanying changes in atmospheric CO2 concentration due to changes in ocean water temperature. At low CO2 concentrations plant growth is reduced which slightly changes the planetary albedo.
In the "hot" state the atmospheric CO2 concentration is well above 300 ppmv. The south polar ice cap melts and the dominant source of emitted infrared radiation is latent heat of vaporization released by condensation of water vapor in clouds. The high CO2 concentration promotes high plant growth. The high surface temperature causes an extinction of all large land animals.
These distinct stable temperature states exist because the solar reflectivity of the open ocean (0.035) is only about 6% of the solar reflectivity of ice (0.60). The freezing point of water, 0 degrees C = 273.15 degrees K, is almost independent of pressure and hence is almost independent of altitude. Thus at 273.15 degrees K the solar reflectivity of both surface water and air borne water droplets or ice particles goes through a large step change.
There is another less acute change in the solar reflectivity of the open ocean at about 42 degrees C in the "hot" state at which temperature a lot of floating green gunk forms on the ocean water surface. A sufficient density of this green gunk can raise the albedo of the water from 0.035 to as much as 0.20. The growth of this green gunk is promoted by the high atmospheric CO2 concentration that accompanies a high ocean water temperature.
The major changes in planetary albedo are sufficiently large to over ride temperature changes due to changing Earth emissivity arising from changing atmospheric CO2 concentration.
Historical transitions into the "hot" state, such as during the PETM (Paleocene Eocene Thermal Maximum) 56 million years ago, were rare and may have been triggered by astophysical events such as the passage of another star near the solar system.
Thermal Runaway is the name given to a transition from the "cool" state to the "hot" state. The current state transition in progress is a result of large scale combustion of fossil fuels which has reduced both Earth's far infrared emissivity Ft and Earth's solar reflectivity (Bond albedo) Fr. The rate of this state change temperature transition is limited by the rate of net radiant energy absorption by Earth and by the effective heat capacity of the oceans and the polar ice caps. Measurements of absorbed solar power and emitted infrared power made during the period 1996 to 2000 indicate that at that time Earth was warming at about 0.036 degrees C per year. That measurement is consistent with measured changes in average Earth surface temperature. However, the rate of this temperature rise is projected to increase as much as five fold during the coming decades.
The climate literature refers to Thermal Runaway as being due to tipping Points.
This web page addresses the physics of thermal runaway. Another web page addresses a related phenomena known as HOT STATE TRAPPING caused by the increase in ocean surface temperature. As its name implies, "hot state trapping" traps Earth in its "hot" state. Exiting from the "hot" state requires a natural decrease in the CO2 concentration in the ocean-atmosphere pool which takes hundreds of thousands of years to occur.
Thermal runaway is an immediate threat to the survival of mankind. If present fossil fuel related emissions continue spontaneous thermal runaway will cause the average temperature to rise about 17 degrees C. The underlying problem is that present governmental plans, even if fully implemented, are not sufficient to halt thermal runaway. Achieving the atmospheric CO2 concentration reduction required to halt thermal runaway requires all industialized countries to leave fossil carbon in the ground. As indicated by the 2015 Paris Agreement on climate change and by continuing investment in fossil fuel infrastructure, most elected governments are simply unwilling to face the issue of immediately ceasing use of fossil carbon.
In order to understand how multiple distinct stable temperature states occur on Earth it is necessary to understand the non-linear processes that regulate Earth's average thermal infrared emission temperature Tc.
BOND ALBEDO Fr:
The Bond albedo Fr of Earth is the fraction of solar radiant power incident on Earth that is reflected into space. The Bond albedo increases with the number of water molecules in Earth's atmosphere that are in the form of ice. This number is the product of the total number of water molecules in Earth's atmosphere times the fraction of these water molecules that are in the solid state. This fraction is highly dependent on cloud temperature and hence emission temperature. In November 1996 Earth's "cool" state average emission temperature Tc was measured as:
Tc = 270.0 K.
However, the emission temperature varies with latitude. It declines towards the poles and declines a bit near the equator. Thus in the temperate region the local emisson temperature is near the freezing point of water. The importance of this issue is that in countries such as Canada excess CO2 in the atmosphere will raise the cloud temperature from below 273.15 K to above 273.15 K which substantially reduces the local albedo, thus amplifying the effect of CO2 warming several fold.
A step increase in Earth's upper atmosphere CO2 concentration will cause Tc to increase. As the ocean surface temperature rises the atmospheric CO2 concentration and hence Tc will further rise reducing cloud albedo. As the ocean surface temperature rises polar ice melts which causes a further decrease in planetary albedo. Hence more solar radiation is absorbed. Hence the ocean surface temperature continues rising which causes a further increase in Tc.
As the local emission temperature (top of cloud temperature) Tc rises through 273.15 K, the freezing point of water, the local Bond albedo rapidly decreases. Earth's planetary Bond albedo decreases from an average of about 0.30 in the "cool" state to an average of about 0.10 in the "warm" state. The dependance of local Bond albedo on local atmospheric temperature is readily apparent on photos of Earth taken from deep space that show varying levels of reflected solar illumination. In 1972 the local Bond albedo near Earth's equator was about 0.10 as compared to a local bond albedo of about 0.50 near Earth's poles. In 1998 - 2000 the average Bond Albedo of the whole Earth was measured to be about 0.297.
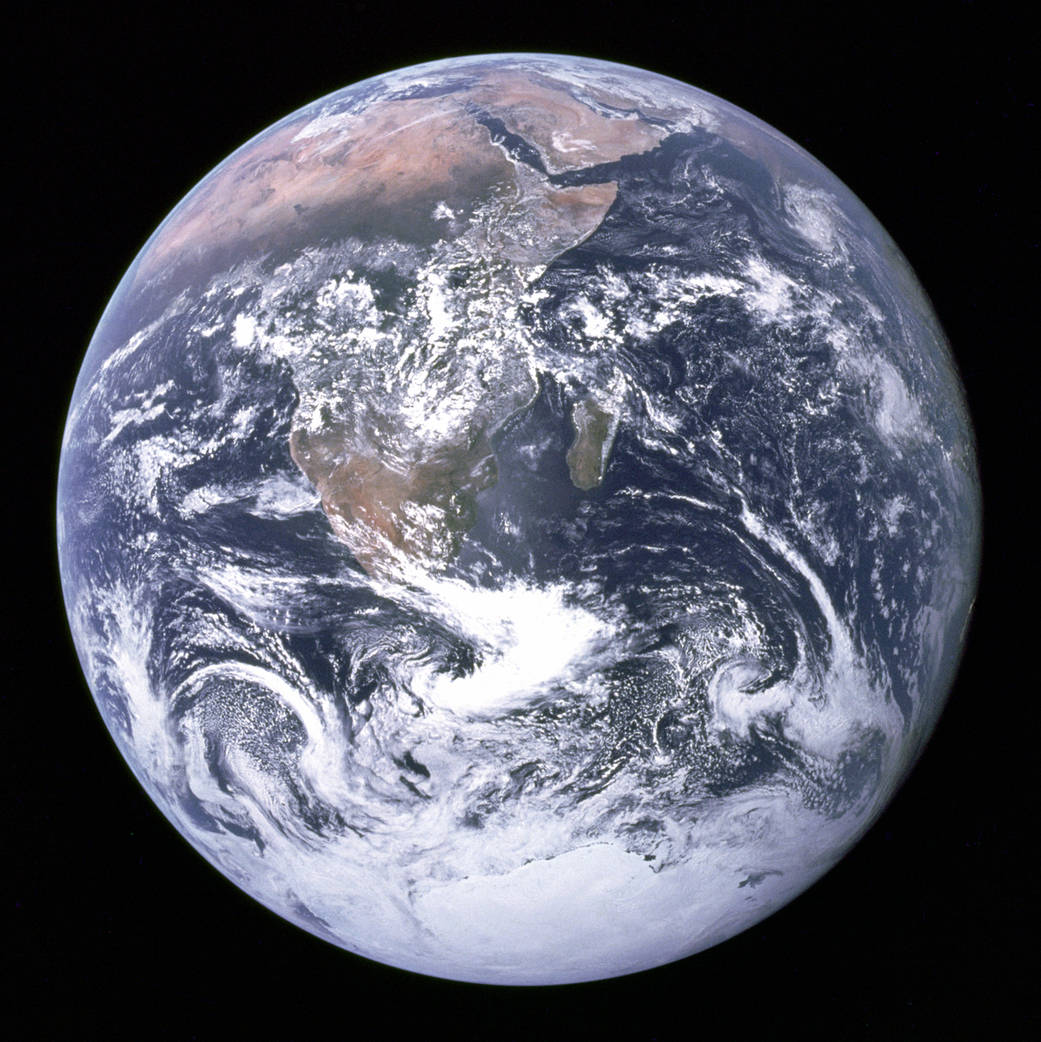
The change in local albedo with local temperature is readily apparent on visible light photos of the Earth from deep space, as shown on on Figure 1, a photo of Earth from deep space taken from Apollo 17 in December 1972.
When the Earth is in its normal "cool" state the dominant clouds are mostly composed of microscopic ice crystals and part of the Earth's surface is ice covered. When the Earth is in its "hot" state the dominant clouds are mostly composed of microscopic water droplets and almost all of the Earth's surface is free of snow and ice. In between these two extremes Earth is in a semi-stable "warm" state. As the local temperature rises from below 273.15 K to above 273.15 K the dominant clouds change from being brilliant white to dark grey and surface snow and ice melts.
Visible light photographs of the Earth taken from deep space clearly show that the local albedo of the Earth is much less in the tropics where the atmosphere is warm than near the poles where the atmosphere is cooler. These photographs show that the planetary Bond albedo of Earth will decrease from about 0.30 to about 0.10 due to an increasing Earth surface temperature. If the infrared emissivity of the Earth sufficiently decreases due to an increase in Earth's atmospheric CO2 concentration then all the requirements for thermal runaway are met.
Figure 1 - Earth From Space Apollo 17 Dec. 1972
Note that the local albedo of the Earth is smaller at low latitudes where the atmosphere is warm than at high latitudes where the atmosphere is cool.
Published astronomical data indicates that the Bond albedo of Earth, as measured by comparing the intensity of the reflection of Earthshine from the face of the moon not illuminated by the sun to the intensity of the reflection of direct solar illumination from the illuminated face of the moon, has decreased from 0.31 in the early 1990s, to 0.297 in 1998-2000, to 0.290 in 2015-2016.
Note that in the normal "cool" state the experimentally measured value of Fr early in the 1990s was 0.31 and during 1998 - 1999 was:More recent astronomical data indicates that currently Fr = 0.29. Reference:Hyperphysics
Satellite measurements over the period 1980 t0 2014 show that the local albedo in the Arctic is declining at about 0.94% / decade. If that rate of change of polar local albedo continues it will take about 300 years for planet Earth to fully transition from its present cool state to a future hot state that will be about 17 degrees C warmer. However, the real issue is will it be possible to stop that trend of declining polar local albedo?
A problem with direct astronomical measurements of Fr is that the error bars slightly overlap, which introduces substantial uncertainty into calculations of the rate of change of Fr with emission temperature and time. There are small variations in solar output, and hourly and seasonal changes in Earth reflectance Fr which must be eliminated by averaging over sufficient time. The problem is further complicated by the necessity to ensure that the angles of incidence and viewing of the solar illumination on the moon are the same as the angles of incidence and viewing of the Earthshine. Typically an accurate measurement of Fr takes more than two years to perform.
Satellites can effectively measure local albedo but most satellites are too close to the Earth to directly and accurately measure planetary Bond albedo Fr. Values of Fr derived from most satellite data involve so many assumptions that the results have little useful value. The Bond albedo of the Earth could potentially be directly measured by an interplanetary space vehicle. However, the cost of such a space vehicle measurement to three significant figures would be several billion US dollars and would need to be repeated annually to be useful.
In the normal "cool" state:
Fr = Frc.
In the "warm" state:
Fr = Frw.
Experimental measurements of the Earth's "cool" state planetary albedo Frc gave:
Frc = 0.31 during the early 1990s
and
Frc ~ 0.297 during 1998 and 1999.
Any measurement of Fr is of necessity a value that is time averaged over one or two years. Due to cloud movement and seasonal changes in folliage reflectivity the instantaneous value of Fr varies from day to day and season to season.
Note that the planetary Bond albedo Fr is an average of time varying local Bond albedo values. At any instant in time the planetary Bond albedo is the average of the local Bond albedo values over the Earth's sun facing surface. The local Bond albedo at any particular geographical position varies with time due to foliage, surface water, snow, ice, cloud formation and cloud movement.
EFFECT ON EMISSION TEMPERATURE:
As the planetary emissivity Ft decreases due to an increasing atmospheric CO2 concentration the lower atmosphere traps heat and gradually warms. This warming raises the emission temperature T measured at wavelengths outside the GHG absorption bands. If there was no change in albedo or in solar irradiance at steady state conditions there would be no change in the infrared emitted power = As Ft Cb T^4 . However, global warming melts both surface and air borne ice which reduces the planetary Bond albedo Fr. Hence, the average absorbed thermal power per unit area:
(1 - Fr) H Ac
increases. At steady state:
(1 - Fr) H Ac = As Ft Cb T^4
or
T^4 = (1 - Fr) H Ac / As Ft Cb
= (1 - Fr) H / 4 Ft Cb
Thermal runaway will occur when T rises from 270 K to 273.15 K. Relatively small decreases in Fr and Ft will cause T to rise from 270 K to 273.15 K and hence will trigger thermal runaway. Today this process is happening over the circumpolar countries. A small consistent increase in average lower atmospheric temperature decreases the annual average local albedo which leads to increased solar energy absorption.
PHYSICAL EXPLANATION:
Consider a vertical column of air at a particular latitude. At sea level, due to solar energy absorption by the ocean, water evaporates. The latent heat of vaporization is expressed by water molecules as linear and rotational kinetic energy. As a water vapor molecule diffuses up the air column this kinetic energy is gradually transferred to N2 and O2 molecules in the air via molecular collisions. The resulting nearly stationary water molecules clump together (condense) to form liquid water micro-droplets.
In that column of air energy is lost out the top of the column via emission of infrared radiation into space so the air temperature in the column decreases with increasing altitude A. At altitude:
A = Af
in the air column the local air temperature is:
273.15 degrees K = To,
= the freezing point of water.
The freezing point of water is almost independent of ambient air pressure.
At:
A > Af
liquid water micro-droplets in the air column form ice micro-crystals by emission of infrared radiation photons which carry into outer space the latent heat of fusion of the H2O. This photon emission occurs because the infrared emissivity of H2O near 273.15 K (its freezing point) is very high. Near this temperature there is strong coupling between H2O molecular vibrations and infrared radiation.
After some time the resulting ice micro-crystals fall and at:
A < Af
the ice micro-crystals acquire sufficient kinetic energy from N2 and O2 molecules in the air column to partially melt and become liquid water micro-droplets.
These micro-droplets containing some ice nucleation crystals again diffuse up the air column and emit infrared photons into space.
This infrared energy emission process continues as long as there is heat available to drive it. When the available heat is exhausted the water micro-droplets combine with other water micro-droplets and fall as rain or other forms of precipitation.
The number of H2O molecules per unit volume in the air column decreases exponentially with increasing altitude. Hence as altitude Af increases due to an increasing Earth emission temperature the number of H2O molecules in the column of air that exist as ice micro-crystals decreases.
Ice micro-crystals reflect solar radiation back into space much more efficiently than do liquid water micro-droplets. Thus as the Earth's emission temperature increases the number of ice micro-crystals reflecting solar radiation back into space decreases and hence the Earth's Bond albedo decreases. Note that the solar reflection occurs because of the crystal structure and index of refraction of ice. The speed of light in ice is less than the speed of light in air. There is no narrow band molecular energy absorption involved in this solar energy reflection process.
CALCULATION OF Fr
Note that Fr is an average of many individual local albedo Fri values. The local albedo Fri varies widely with position and time. If there is dense white cloud:
Fri ~ 0.5
whereas when there is no cloud:
over the ocean:
Fri = .035
and over dry land the average value of Fri is about:
Fri = 0.2576
CALCULATION OF Frc:
Frc = Fr|"cool" state
Data assumptions:
Fraction of Earth's sun facing surface covered by cloud = 0.50
Local albedo of normal "cool" state cloud = 0.50
Fraction of Earth's sun facing surface not covered by cloud = (1.0 - 0.5) = 0.5
Local albedo of ocean with no cloud cover = 0.035
Fraction of Earth's sun facing surface covered by ocean = 0.708
Average local albedo of land with no cloud cover = 0.2576
Average local albedo of Earth's sun facing surface not covered by cloud:BR>
= 0.2576 (1 - .708) + .708 (.035) = 0.10
"Cool" state bond albedo Frc is given by:
Frc = 0.5 (0.5) + 0.5 (0.1)
= 0.25 + 0.05
= 0.30
(In the year 2000 the measured value of Frc was:
Frc = 0.297)
CALCULATION OF Frw:
Frw = Fr|"warm" state
Data assumptions:
Fraction of Earth's sun facing surface covered by cloud = x
Local albedo of "warm" state cloud = 0.10
Fraction of Earth's sun facing surface not covered by cloud = (1.0 - x)
Local albedo of ocean with no cloud cover = 0.035
Fraction of Earth's sun facing surface covered by ocean = 0.708
Average local albedo of land with no cloud cover = 0.2576
Average local albedo of Earth's sun facing surface not covered by cloud:BR>
= 0.2576 (1 - .708) + .708 (.035) = 0.10
"Warm" state bond albedo Frw is given by:
Frw = x (0.1) + (1 - x) (0.1)
= 0.10
CHANGE IN Fr ACCOMPANYING MELTING OF POLAR ICE:
The change in Fr accompanying total melting of polar ice is:
dFr = (Frw - Frc)
= (0.1 - 0.3)
= - 0.2
Most of the change in Fr with temperature occurs at temperatures close to T = To.
STATE COMPARISON:
In the "cool" state part of the Earth is snow or ice covered and brilliant white clouds, formed from ice micro-crystals, cover about half of the Earth's sun facing surface. In the "warm" state the entire Earth is free of snow and ice and dark grey clouds formed from liquid water micro-droplets cover a portion of the Earth's sun facing surface.
In the "cool" state ice micro-crystals in clouds and surface ice reflect incident solar radiation photons back into space much more effectively than do "warm" state liquid water micro-droplets in clouds and the open ocean. Hence the solar power absorbed by the Earth in the "warm" state is ~ 28.5% larger than in the "cool" state. At steady state conditions in the "warm" state the increase in solar power absorption is balanced by an increase in infrared radiant energy emission due to an increase in the Earth's steady state emission temperature T from its "cool" state value Tc to its "warm" state value Tw
QUANTIFICATION OF ABSORBED SOLAR RADIATION
Define:
Ho = Solar irradiance
= (total radiant power emitted by the sun) / [4 Pi (Earth orbit radius)^2]
= 1365 W / m^2,
which calculation is valid because the Earth's present orbit around the sun is nearly circular. The solar irradiance has been accurately measured by numerous artificial satellites over a 50 year period and is quite stable. However, over times of the order of 100,000 years Ho changes significantly due to the Milankovich cycle.
Define:
Ac = Earth cross sectional area
As = Earth total surface area
The average solar power per unit of Earth surface area As absorbed by the Earth is:
(Ho Ac / As) (1 - Fr)
where:
Fr = fraction of incident solar energy that is reflected off the Earth
= Bond Albedo for the entire Earth
If a graph plot is made of solar power per unit total Earth surface area absorbed by Earth as a function of Earth's absolute emission temperature the parameters that are plotted are:
(Ho Ac / As) (1- Fr) versus T
T = Earth's emission temperature
The Bond albeso of Earth changes abruptly at the freezing point of water where T = To
Then for:T < To:
the solar reflectivity Fr of Earth is:
Fr = Frc ~ 0.30
giving:
absorbed solar power = Ho (1 - Frc) Ac
Published astronomical data indicates that the Bond albedo of Earth, as measured by comparing the intensity of the reflection of Earthshine from the face of the moon not illuminated by the sun to the intensity of the reflection of direct solar illumination from the illuminated face of the moon, has decreased from 0.31 in the early 1990s, to 0.297 in 1998-2000, to 0.290 in 2015-2016.
For T > To:Thus Fr as a function of T takes the form:
Fr = [Frc H(To - T) + Frw H(T- To)]
where:
for T > To H(T-To) = 1
and
for T < To H(T-To) = 0
This function is plotted on Figure A __________
Thus the solar power per unit of total Earth surface area As absorbed by Earth as a function of absolute emission temperature can be approximated by a step function of the form:
Absorbed radiant power / unit of Earth surface area
= (Ho Ac / As) [(1 - Frc) H(To - T) + (1 - Frw) H(T- To)]
ANALYTIC REPRESENTATION OF Fr:
In reality there is some scatter in local T values near To. Hence in a real situation the value of the slope:
{d[(1 - Fr) / Ft] dT|T = To}
is not infinite.
Recall that:
Fr = Frc H(To - T) + Frw H(T - To)
To convert this expression to an analytic function use the relationships:
H(To - T) = 1 / [(T / To)^Kf + 1]
and
H(T- To) = (T / To)^Kf / [(T / To)^Kf + 1]
where:
Kf ~ 600
Then:
1 - Fr = 1 - Frc H(To - T) - Frw H(T - To)
= 1 - {Frc / [(T / To)^Kf + 1]} - {Frw (T / To)^Kf / [(T / To)^Kf + 1]}
= {[(T / To)^Kf + 1] - Frc - Frw (T / To)^Kf} / [(T / To)^Kf + 1]}
= {(1 - Frc) + (1 - Frw)[(T / To)^Kf]} / [(T / To)^Kf + 1]
Thus for Frc = 0.297 and for Frw = 0.10:
{( 1 - Fr) = {0.703 + 0.9 [(T / To)^Kf]} / [(T / To)^Kf + 1]
The value of Kf sets the temperature at which thermal runaway will go out of control due to the slope of the function [(1 - Fr) / Ft] being equal to the slope of the function Ft Cb T^4 In that respect a large value of Kf is desirable.
The finite slope leads to:
(1 - Fr)
having a functional representation in the temperature range:
265 K < T < 295 K
of the form:
( 1 - Fr) = {0.703 + 0.9 [(T / To)^Kf]} / [(T / To)^Kf + 1]
where:
To = 273.15 K
at which temperature the solar spectrum optical properties of water change rapidly with temperature;
and
Kf ~ 600
where Kf is constrained by [(1 - Fr) / Ft] function slope requirements at:
T = Tr,
and at:
T = Tc
and at:
T = Tw.
Note that Fr varies over the range Tc < T < Tw and takes nearly constant values for T < Tc and for T > Tw.
From a mathematical perspective, if Earth is neither gaining nor losing net energy:
[(1 - Fr) / Ft] = (Cb / Po) T^4
and if
{(d[(1 - Fr) / Ft] / dT)|T = Tr} > {(Cb / Po)[d(T^4) / dT]|T = Tr}
then T potentially has two locally stable real solutions. The temperature separation between these two solutions depends on the values of Fr at saturation. Saturation occurs because when the Earth is hot Fr will not fall below about:
Fr = 0.100
and when the Earth is cool Fr will not exceed about:
Fr = 0.31
until Earth is so cold that the ocean surface freezes.
Recall that:
(1 - Fr) = ( 1 - Fr) = {0.703 + 0.9 [(T / To)^Kf]} / [(T / To)^Kf + 1]
If Kf is sufficiently large:
(T / To)^Kf << 1
then:
(1- Fr) = 0.703
Kf must also be sufficiently large to meet the boundary conditions on (dFr / dT) at T = Tc and at T = Tr.
If:
(T / To)^Kf >> 1
then:
(1 - Fr) = 0.90
DETERMINATION OF Tw:
The warm state temperature Tw lies on the steady state line. Hence:
{0.703 + 0.900 [(T / To)^Kf]} / [(T / To)^Kf + 1] / Ft = (Cb / Po) Tw^4
However, in the warm state:
[(Tw / To)^Kf] >> 1
giving:
0.900 / Ft = (Cb / Po) Tw^4
or
0.900 / 0.7973494737 = (Cb / Po) Tw^4
which can be solved for Tw. Note that the "warm" state temperature Tw varies slightly with variations in Ft.
DERIVATIVE PROPERTIES:
Assume that near T = To:
dFt / dT << dFr / dT
Note that:
Tc < Tr < To < Tw
{d[(1 - Fr) / Ft] / dT|T = Tc} < 4 (Cb / Po) Tc^3
This inequality sets a minimum value on Kf
{d[(1 - Fr) / Ft] / dT|T = Tr} > 4 (Cb / Po) Tr^3
This inequality further constrains Kf
{d[(1 - Fr) / Ft] / dT|T = Tw} < 4 (Cb / Po) Tw^3
This inequality sets another minimum value on Kf
If Kf is sufficiently large to meet the derivative constraints on (dFr / dT) then:
(Tc / To)^Kf << 1
and at T = Tc:
(1 - Fr) = 0.703
At T = Tc and at T = Tw the large value of Kf established by the derivative constraints forces:
(dFr / dT) = 0
FIND d[(1 - Fr) / Ft] / dT
Recall that:
[(1 - Fr) / Ft] = {0.703 + 0.900 [(T / To)^Kf]} / [(T / To)^Kf + 1] / Ft
d[(1 - Fr) / Ft] / dT
= (1 / Ft){[(T / To)^Kf + 1] 0.900 Kf (1 / To)[(T / To)^(Kf-1)] - [0.703 + 0.900 [(T / To)^Kf]] Kf (1 / To)[(T / To)^(Kf - 1)]}
X (1 / [(T / To)^Kf + 1]^2)
= (Kf / To Ft)(1 / [(T / To)^Kf + 1]^2)[(T / To)^(Kf-1)] {[(T / To)^Kf + 1] 0.900 - [0.703 + 0.900 [(T / To)^Kf]]}
= (Kf / To Ft)(1 / [(T / To)^Kf + 1]^2)[(T / To)^(Kf-1)] {0.900 - [0.703 ]}
= (0.197 Kf / To Ft){[(T / To)^(Kf-1)] / [(T / To)^Kf + 1]^2}
FIND {d[(1 - Fr) / Ft] / dT|T = To}
{d[(1 - Fr) / Ft] / dT|T=To}
= (0.197 Kf / To Ft){[(To / To)^(Kf-1)] / [(To / To)^Kf + 1]^2}
= (0.197 Kf / To Ft){[1] / [1 + 1]^2}
= (0.197 Kf / 4 To Ft)
FIND {d[(1 - Fr) / Ft] / dT|T = Tc}
{d[(1 - Fr) / Ft] / dT|T=Tc}
= (0.197 Kf / To Ft){[(Tc / To)^(Kf-1)] / [(Tc / To)^Kf + 1]^2}
~ (0.197 Kf / To Ft){[(Tc / To)^(Kf-1)]
= (0.197 Kf / Tc Ft){[(Tc / To)^Kf]
~ 0
FIND {d[(1 - Fr) / Ft] / dT|T = Tw}
{d[(1 - Fr) / Ft] / dT|T=Tw}
= (0.197 Kf / To Ft){[(Tw / To)^(Kf-1)] / [(Tw / To)^Kf + 1]^2}
= (0.197 Kf / Tw Ft){[(Tw / To)^Kf] / [(Tw / To)^Kf + 1]^2}
~ (0.197 Kf / Tw Ft){1 / (Tw / To)^Kf}
= 0
FIND {d[(1 - Fr) / Ft] / dT|T = Tr}
{d[(1 - Fr) / Ft] / dT|T=Tr}
= (0.197 Kf / To Ft){[(Tr / To)^(Kf-1)] / [(Tr / To)^Kf + 1]^2}
Recall that:
{d[(1 - Fr) / Ft] / dT|T = Tr} = 4 (Cb As/ Ho Ac) Tr^3
giving:
(0.197 Kf / To Ft){[(Tr / To)^(Kf-1)] / [(Tr / To)^Kf + 1]^2} = 4 (Cb As/ Ho Ac) Tr^3
or
(0.197 Kf / To Ft){[(Tr / To)^(Kf-1)] / [(Tr / To)^Kf + 1]^2} = 4 (Cb As / Ho Ac) To^3 (Tr / To)^3
or
(0.197 Kf / To Ft){[(Tr / To)^(Kf-4)] / [(Tr / To)^Kf + 1]^2} = 4 (Cb As / Ho Ac) To^3
or
or
(0.197 Kf / 4 Ft){[(Tr / To)^(Kf-4)] / [(Tr / To)^Kf + 1]^2} = (Cb As / Ho Ac) To^4
which gives the relationship between Kf and Tr.
NUMERICAL EVALUATION OF Kf:
Recall that:
{d[(1 - Fr) / Ft] / dT|T=To} = (0.197 Kf) / (4 To Ft)
Hence:
(0.197 Kf) / (4 To Ft) > 0.013 / K
or
Kf > (0.0135 / K)(4 To Ft) / 0.197
or
Kf > 54.47
In practice to simultaneously meet all the boundary conditions Kf ~ 600.
INFRARED ENERGY EMISSION
The Earth, as viewed from outer space on November 24, 1996, appears to be a uniform 270.0 degree K black body covered by an upper atmosphere with prominent far infrared emission "absorption bands" due to atmospheric H2O, CO2 and O3. Along with these prominent "absorption bands" are lesser "absorption bands" due to other gases such as CH4 and N2O.
The thermal infrared radiation that is emitted by the Earth into outer space primarily originates at altitudes:
A ~ Af
where Af is the altitude at which the liquid-solid phase change of water occurs. In spite of the wide range of Earth surface temperatures, for radiation frequencies outside of the upper atmosphere "absorption bands" the emission temperature of the infrared radiation emitted by the Earth is almost constant at 270.0 K.
Note that the altitude of the 270.0 K infrared emission is generally higher at low latitudes than at high latitudes due to variations in Earth surface temperature.
It should be noted that the upper atmosphere "absorption bands" are really frequency bands in which radially propagating far infrared radiation is scattered in random directions. However, from the perspective of a distant observer in outer space these bands appear to be "absorption bands".
Ceres satellite data indicates that Earth's IR power emission is highest at temperate latitudes and decreases both in the tropics and near the poles. This data is consistent with a decrease in the IR emissivity of water above its freezing point. The IR emission near the poles is expected to decrease due to the lower polar temperature.
The decrease in the IR emissivity of water above its freezing point indicates that in the IR frequency region water liquid / vapor molecules reflect a larger portion of incident IR radiation than does ice. This behaviour is different than for solar radiation which is preferentially reflected by ice as compared to liquid water. This change in behavior with radiation frequency is likely related to the unusual physical structure, vibration, rotation and oscillation modes of water molecules.
From quantum mechanics the infrared radiant power P per unit area (W / m^2) emitted by Earth is given by:
(P / As) = Ft Cb T^4
where:
As = surface area of Earth in m^2
Ft = Earth emissivity where 0 < Ft < 1
Cb = 5.6697 X 10^-8 W / m^2-K^4 = Stefan-boltzmann constant
T = absolute temperature in degrees K
The infrared emissivity Ft is a function of the Earth's atmospheric gas mixture. Earth's infrared emissivity is dependent on the atmospheric concentrations of H2O, CO2, O3, CH4, and NOx, each of which obstruct thermal infrared emission in bands within the far infrared spectrum. Typically doubling the atmospheric CO2 concentration causes about a 5% reduction in Ft.
On November 24, 1996 the Mars Global Surveyor spacecraft measured Earth's average emission temperature outside the GHG absorption bands as:
Ta = 270 K to 270.8 K.
This value was a snapshot in time and may need correction for day-night temperature cycling and for spacecraft latitude.
The emission temperature Ta of the Earth in its near normal "cool" state was obtained from a far infrared spectrum of the Earth recorded on November 24, 1996 by the Mars Global Surveyor spacecraft while on its way to Mars. The original data is shown on Figure 3. Note that this is a non-steady state measurement.
Figure 3 - Earth Thermal IR Emission Spectrum
The red line on Figure 3 shows a theoretical black body (Ft = 1.0) emission curve for an emission temperature of 270.0 degrees K. This curve matches the black line outside the GHG absorption bands. The effect of the GHG absorption bands is to reduce Ft. The blue line on Figure 3 shows a corresponding theoretical black body emission curve for an emission temperature of 215.0 degrees K and is the effective temperature of the upper atmosphere in the radiation frequency band where CO2 most greatly attenuates infrared radiation emission originating in the lower atmosphere. The wiggling black line is the experimentally recorded infrared thermal emission spectrum of the whole Earth as viewed from deep space over Hawaii on a November 24, 1996. The infrared absorption bands due to H2O, CO2 and O3 are marked.
The frequency dependent emissivity Ft(w) is the ratio of:
(amplitude of black line) / (amplitude of red line red line).
Figure 3 shows that Ft(w) is strongly affected by the concentrations of H2O, CO2 and O3 in the Earth's atmosphere. Note that the main infrared emission is due to liquid water giving up its latent heat of fusion. This emission spectrum is further filtered by CO2, H2O and O3 molecules at higher altitudes.
The graph on Figure 3 can be numerically analyzed to find the dependence of Ft on the atmospheric CO2 concentration and on the atmospheric H2O concentration.
An atmospheric CO2 concentration measurement at Mona Loa, Hawaii, on November 24, 1996 indicated an atmospheric CO2 concentration of 360.76 ppmv.
The corresponding atmospheric temperature at the Earth's surface in Honolulu, Hawaii on November 24, 1996 was measured to be about:
76.9 F = 24.94 C
= 298.09 K.
Reference:Thermal Emission Spectrometer
This emission temperature appears to be uniform over the Earth's surface, indicating that the dominant source of the emitted infrared radiation is from the liquid-solid phase transition of water in the Earth's atmosphere which occurs at a uniform temperature, independent of latitude and almost independent of altitude.
THE RATIO (As / Ac)
If Earth was a perfect sphere of radius Re geometry indicates that its cross sectional area Ac would be:
Ac = Pi Re^2
and its surface area As would be:
As = 4 Pi Re^2
giving:
As = 4 Ac
In reality due to the rotation of Earth about its axis Earth is not a perfect sphere. It is slightly flattened at the poles. According to Loeb et al the exact relationship between As and Ac is given by:
As = 4.0034 Ac
PHOTON ENERGY LIBERATED BY LATENT HEAT OF FUSION OF WATER:
The latent heat of fusion of water is:
334 J / gm
One mole of water has a mass of 18 gm and contains 6.023 X 10^23 molecules.
Hence the energy per molecule liberated by the liquid-solid phase transition is:
334 J / gm X 18 gm / mole X 1 mole / 6.023 X 10^23 molecules = 998.17367 X 10^-23 J/ molecule
Assume that release of the latent heat of fusion on average liberates one photon per H2O molecule.
Then:
998.17367 X 10^-23 J = h F
where:
h = Planck Constant
= 6.62607004 ū 10-34 m2 kg / s
and
F = radiation frequency
and
C = speed of light
= 3 X 10^8 m / s.
Then:
Wave Number = F / C
= 998.17367 X 10^-23 J / (h C)
= 998.17367 X 10^-23 J / (6.62607004 ū 10-34 m2 kg / s X 3 X 10^8 m / s)
= 50.21 X 10^3 J s^2/ m^3 kg
= 50.21 X 10^3 kg m^2 s^2/ s^2 m^3 kg
= 50.21 X 10^3 / m
= 502.1 / cm
As shown on Figure 3, the experimentally recorded graph of infrared power emission versus wave number, 502.1 / cm is close to the center wave number of the far infrared emission from the Earth recorded by the thermal emission spectrometer carried by the Mars Global Surveyor space craft. Hence the dominant source of thermal infrared radiation emitted by the Earth in November 19996 was the liquid-solid phase change (freezing) of water micro-droplets in the Earth's atmosphere. This conclusion is consistent with the results of numerous other investigations of the interaction of water with infrared radiation.
References: Infrared Absorption By Water #1 and
Infrared Absorption By Water #2
CONSERVATION OF ENERGY:
The average thermal power per unit of Earth surface area produced via chemical and nuclear reactions is Pn. The Earth emits heat via infrared radiative energy emission.
The law of conservation of energy requires that:
(radiant solar power absorbed by Earth) + (heat generated via chemical and nuclear reactions)
= (radiant infrared power emitted by Earth) + (the change in enthalpy of Earth).
Hence:
Ho Ac [(1 - Frc) H(To - T) + (1 - Frw) H(T- To)] + Pn As = As Ft Cb T^4 + Pa As
or
[(1 - Frc) H(To - T) + (1 - Frw) H(T- To)] / Ft = [(As Cb T^4) / Ho Ac] + (Pa - Pn) (As/ Ho Ac)
This eqiation is simply the law of conservation of energy. There are no climatic assumptions.
TWO STABLE STATES:
The non-linear equations that establish Earth's steady state average infrared emission temperature have two distinct real solutions, one below the freezing point of water referred to herein as the "cool" state at:
T = Tc
and the other above the freezing point of water referred to herein as the "warm" state at:
T = Tw.
These two stable states explain the existence of Earth's periodic ice ages.
There is a "moderate" state between the "cool" state and the "warm" state. In the "moderate" state the atmosphere is in the "cool" state at high latitudes and in the "warm" state at low latitudes. In the "cool" state the IR emission decreases with decreasing temperature. In the warm state there is no fusion of water molecules so there is an effective decrease in IR emission.
The temperature state that is actually occupied at any instant in time at any position depends on the prior history of Earth's atmosphere.
The left hand side (LHS) of the energy conservation equation takes two values, one for T > To and one for T < To. The right hand side (RHS) of the energy conservation equation takes a broad range of values depending on temperature T. The left hand side (LHS)of this equation contains the parameters Fr and Ft, both of which are uncertain functions of T. The right hand side (RHS) of this equation is a precisely known function of T.
Note that Pa = 0 at steady state conditions.
If the functions of T:
[(1 - Frc) H(To - T) + (1 - Frw) H(T- To)] / Ft
and
[(As Cb T^4) / Ho Ac]
are both plotted on the same graph sheet the trace lines will intersect at either one or two steady state points. If there are two intersection points the warmer steady state temperature Tw is given by:
(1 - Frw) / Ft = [(As Cb) / Ho Ac] Tw^4
and the cooler steady state temperature Tc is given by:
(1 - Frc) / Ft = [(As Cb) / Ho Ac] Tc^4
Combining these two equations gives:
(1 - Frw) / Tw^4) = (1 - Frc) / Tc^4)
or
(Tw / Tc)^4 = (1 - Frw) / (1 - Frc)
Hence:
(Tw / Tc) = [(1 - Frw) / (1 - Frc)]^0.25
~ [[0.9 / 0.7]^0.25
= 1.064844317
[(Tw - Tc) + Tc] / Tc = 1.064844317
or
[(Tw - Tc)] / Tc = 0.064844317
or
[(Tw - Tc)] = 0.064844317 Tc
For Tc ~ To:
Tw - Tc = .064844317 To
= 17.71 degrees K
Recall that Tw > To and that Tc < To. In order for two solutions to exist:
at the smallest possible value of Tw ~ To the value of Tc = Tcm is given by:
(To / Tcm)^4 = (1 - Frw) / (1 - Frc)
or
Tcm = [(1 - Frc) / (1 - Frw)]^0.25 To
and at the largest possible value of Tc ~ To the largest possible value of Tw = Twm is given by:
(Twm / To)^4 = (1 - Frw) / (1 - Frc)
or
Twm = To [(1 - Frw) / (1 - Frc)]^0.25
If Tw > Twm
then there is no solution for Tc and the system is or will become trapped in the "warm" state.
Similarly if:
Tc < Tcm
then there is no solution for Tw and the system is or will become trapped in the "cool" state.
An issue of great importance to mankind is a spontaneous transition from the cool state to the warm state which will occur at Tc = To at which point the cool state can no longer exist. Recall that:
(1 - Frc) / Ft = [(As Cb) / Ho Ac] Tc^4
When Tc = To this equation gives:
(1 - Frc) / Ft = [(As Cb) / Ho Ac] To^4
NUMERICAL EVALUATION:
At T = To numerical evaluation of [(1 - Fr) / Ft] and [Cb T^4 As / Ho Ac] ucusing the best available parameter values for the year 1996 of:
Ho = 1365 W / m^2
Frc = 0.297
Ft = 0.7555
Cb = 5.6697 X 10^-8 W / m^2-K^4
To = 273.15 K
gives:
(1 - Frc) / Ft]
= (1- .297) / 0.7555]
= 0.9305095963
Similarly numerical evaluation of As Cb To^4 / Ho Ac gives:
4.0034 Cb To^4 / Ho = 4.0034 X 5.6697 X 10^-8 W / m^2-K^4 X (273.15 K)^4 / (1365 W / m^2)
= 0.9256807503
Hence in the year 1996:
(1 - Frc) / Ft) > As Cb To^4 / Ho Ac
implying that
(Pa - Pn) > 0
so planet Earth was already on a path into thermal runaway. All that is limiting the transition rate is the present relatively small difference between the absorbed solar power and the emitted infrared power terms and the large heat capacity of the oceans.
An imminent danger is an ongoing decrease in Frc due to polar ice melting and an ongoing decrease in Ft due to increasing high altitude atmospheric CO2, H2O and CH4 concentrations which together will increase the term: [(1 - Frc) / Ft].
Another potential danger is an increase in solar irradiance Ho due to solar instability.
Processes that can increase the ocean-atmosphere CO2 concentration include decomposition of limestone due to volcanic heat, combustion of fossil fuels and wide spread wild fires. Processes that can decrease the ocean-atmosphere CO2 concentration include formation of fossil fuels and formation of carbonate rock.
Transient events that can cause changes in Bond albedo include:
the nearby passage of another star, a comet impact, major volcanic activity, wide spread wild fires or an extremity of the Milankovich cycle.
SPECIAL CASES:
At steady state (Pa = 0) at temperatures substantially higher than To:
[(T - To) > 20 deg K]
the polar icecaps are totally melted so the Bond albedo Fr is almost constant at:
Fr ~ 0.10
giving:
{d[(1 - Fr) / Ft] / dT} < 4 (Cb / Po) T^3
At temperatures substantially lower than To where:
[(T - To) < - 20 K]
the ocean surface is entirely frozen so the Bond albedo Fr is almost constant at
Fr ~ 0.5
giving:
{d[(1 - Fr) / Ft] / dT} < 4 (Cb / Po) T^3
ESCAPE FROM THE COOL STATE:
The system escapes from the cool state by a sudden drop in planetary albedo. In the cool state the ocean is cold, the poles are ice covered and the atmospheric CO2 concentration is low. Plants at higher altitudes suffer CO2 starvation causing formation of dust bowl conditions. The resulting dust that is wind blown onto glaciers causes accelerated glacier melting whcich causes a rapid decrease in planetary albedo.
COOL STATE TO MODERATE STATE TRANSITION:
The ocean is initially cool but due to the prior rapid drop in planetary albedo the ocean gradually warms. The equilibrium steady state CO2 concentration rises with the ocean surface temperature. As the CO2 concentration rises so also does the CO2 driven warming fraction. The polar ice melts establishing a new low in planetary albedo. The ocean absorbs heat and the ocean temperature gradually rises to establish the stable moderate state temperature.
ESCAPE FROM THE STABLE WARM STATE:
In the stable "warm" state the ocean surface is very warm and the atmospheric CO2 concentration is high. Floating green gunk rapidly grows on the ocean surface. The presence of this green gunk floating on the ocean surface lowers Earth's planetary Bond albedo. As a result the ocean starts to cool. The cooling ocean absorbs atmospheric CO2 which in turn reduces CO2 driven heating.
MODERATE STATE TO COOL STATE TRANSITION:
The ocean is initially warm but due to the prior rapid increase in planetary albedo the ocean gradually cools. Polar icecaps form which further increase the planetary albedo which causes yet more cooling. The cooling ocean absorbs CO2 from the atmosphere which reduces CO2 warming and hence causes yet more cooling. This cooliing pattern continues until land borne plants suffer CO2 starvation which causes the entire cycle to repeat.
ROLE OF MALINKIVICH CYCLES:
Malinkovich cycles are about 25,000 year periods during which Earth's orbit around the sun changes from being circular to elliptical and back again. These cycles affect the solar irradiance. Hence the aforementioned glacier cycles attempt to phase lock to the Malinkovich cycles.
INJECTION OF CO2 BY COMBUSTION OF FOSSIL FUELS:
Combustion of fossil fuels by mankind raises the atmospheric CO2 concentration. This injection has the effect of causing a cool state to warm state transition. The extra CO2 reduces thermal IR emission by planet Earth which causes some warming. This warming reduces cloud and ice albedo which results in yet more warming. The extra CO2 makes it more difficult for the system to excape from the "warm" state.
WARM STATE TO MODERATE STATE TRANSITION:
Exiting from the warm state cannot occur until the amounts of CO2 in the atmosphere and oceans are reduced by natural formation of fossil fuels. This fossil fuel formation process is slow so exiting from the warm state typically takes 200,000 years.
GRAPHICAL PORTRAYAL OF THE EARTH'S CLIMATE AND CLIMATE CHANGE STATUS:
Recall that at steady state:
[(1 - Fr) / Ft] = (Cb As / Ho Ac) T^4 + [(Pa - Pn) As / (Ho Ac Ft)]
A useful technique for portraying the climate and climate change status of Earth at a particular time is to plot:
(Cb / Po) T^4 versus T with a red line
and on the same graph to plot:
[(1 - Fr) / Ft] versus T with a blue line as shown in Figure 2.
At any instant in time the Earth will be at a point on the red line defined by the emission temperature T at that time. However, the rate of movement left or right along the red line is proportional to the thermal power difference:
Pa = [(Ho Ac / As) (1 - Fr) - (Ft Cb T^4)]
which is simply (Ho Ac / As) Ft times the amplitude difference between the blue line and the red line. Points where the blue and red lines cross are potential steady state solutions for T that should be individually examined for conformance with stability criteria. If the blue line and red line fail to cross then there is either thermal runaway toward the warm state or toward the cool state.
NOVEMBER 1996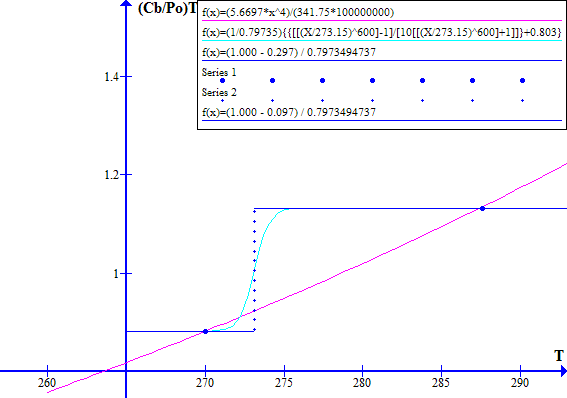
Figure 2
The blue dot at the left hand side is Tc, the historic "cool" state temperature. The blue dot on the right hand side is Tw, the corresponding "warm" state temperature. The intersection of the light blue and red lines between Tw and Tc is at Tr, the historic thermal runaway temperature.
Note that decreasing Fr or Ft effectively moves the blue line vertically up with respect to the red line. Similarly increasing Fr or Ft effectively moves the blue line down with respect to the red line.
Increasing the atmospheric CO2 concentration directly reduces Ft which causes the blue line to move up with respect to the red line. Increasing the atmospheric CO2 concentration increases the emission temperature which via ice melting in clouds and on Earth's surface reduces the Bond albedo Fr and hence causes further upward movement of the blue line with respect to the red line.
STEADY STATE CONDITIONS:
At steady state conditions Earth is neither losing nor gaining net energy and the emission temperature T is constant. Hence:
Pa = 0
and
[(1 - Fr) / Ft] = (As Cb / Ho Ac) T^4 - [(Pn As) / (Ac Ho)]
and the system operates at a stable point close to where the blue and red lines intersect. These intersection points are shown by bold bue dots on Figure 1.
STABILITY CRITERIA:
At points where the red and blue lines intersect the local stability criteria should be examined. At a locally stable state:
Pa = 0
and
[(1 -Fr) / Ft] = (Cb / Po) T^4
and
{d[(1 -Fr) / Ft] / dT} < 4 (Cb / Po) T^3
At a locally stable state if the temperature T is too high then:
(Cb / Po)T^4 > [(1 -Fr) / Ft]
and the Earth spontaneously loses net energy via infrared radiation to return to the locally stable temperature.
Similarly at a locally stable state if the temperature T is too low then:
(Cb / Po)T^4 < [(1 -Fr) / Ft]
and the Earth spontaneously gains net energy from the sun to return to the locally stable temperature.
Consider the red and blue lines intersection point between T = Tc and T = Tw where T = Tr. If:
(Cb / Po) Tr^4 = [(1 - Fr) / Ft]
but
{d[(1 - Fr) / Ft] / dTr } > 4 (Cb / Po) Tr^3
then temperature Tr is unstable and will enable a spontaneous state change.
At T = Tr if the temperature T drifts too high then due to:
[(1 -Fr) / Ft] > (Cb / Po) T^4
the Earth gains yet more net energy from the sun causing T to drift even higher and further away from the point of instability Tr.
Similarly at T = Tr if the temperature T drifts too low then due to:
[(1 -Fr) / Ft] < (Cb / Po)T^4
the Earth loses yet more energy by thermal radiation causing T to drift even further below the point of instability. Thus at T = Tr the Earth spontaneously switches from one locally stable state to the other locally stable state.
CRITERIA FOR THE EXISTENCE OF TWO DISTINCT LOCALLY STABLE EMISSION TEMPERATURE STATES:
Recall that the criteria for the potential existence of two locally stable temperature states is:
{d[(1 - Fr) / Ft] / dT} > 4 (Cb / Po) T^3
The freezing point of water is at 273.15 K.
Numerical evaluation of the right hand side of this inequality at 273.15 K gives:
4 (Cb / Po) T^3 = 4 [(5.6697 X 10^-8 W /m^2-K^4)/(341.74 W / m^2)] [273.15 K]^3
= 0.01352431 / deg K
Thus if:
{d[(1 - Fr) / Ft] / dT} > 0.01352431 / deg K
thermal runaway will occur.
If Fr changes by - 0.2 over an average emission temperature range of less than 17.5 C and if Ft is given by:
Ft = 0.7555
then thermal runaway will occur.
Geophysical data indicates that this phenomena of thermal runaway does in fact occur.
Historically Earth's planetary Bond Albedo was about 0.30 and Earth's average emission temperature was less than Ta = 270 K. Figure 1 shows that with complete ice melting Earth's planetary Bond albedo will drop from about 0.30 to about 0.10. Neglecting changes in Earth infrared emissivity the new average emission temperature Tb will be given by:
(Tb / Ta)^4 = (1 - Frb) / (1 - Fra)
= (1.00 - 0.10) / (1.00 - 0.30)
or
Tb = Ta [0.90 / 0.70]^0.25
= 270 [1.064844317]
Hence:
(Tb - Ta) = 270 K [0.064844317]
= 17.5 K
The emission temperature rise due to a decrease in infrared emissivity is additional.
At the freezing point of open water the local albedo decreases from about 0.5 for ice to as low as .035 for open sea water. For clouds the albedo change is less but clouds still satisfy the criteria:
{d[(1 - Fr) / Ft] / dT|T = Tr} > 4 (Cb / Po) Tr^3
which enables two separate locally stable temperature states.
Thus:
Tc < Tr < Tw
where:
Tc = locally stable "cool" state emission temperature that in November 1996 was less than 270.0 K
Tr = thermal runaway emission temperature
Tw = locally stable "warm" state emission temperature
NON-STEADY STATE CONDITIONS:
If the emitted infrared radiation is less than the absorbed solar radiation, then Earth is gaining net energy and the emission temperature T gradually increases with time at a rate proportional to the power per unit area difference:
Pa - Pn = [(Ho Ac / As) (1 - Fr) - Ft Cb T^4]
divided by the effective heat capacity per unit area.
Then:
[(1 - Fr) / Ft] = (Cb As / Ho Ac) T^4 + [(Pa - Pn) As / (Ho Ac Ft)]
and the blue line is above the red line. Hence a point on the red line spontaneously gradually moves to the right toward a higher temperature. This movement continues until a steady state point is reached as indicated by a bold blue dot.
If the emitted infrared radiation is greater than the absorbed solar radiation, the Earth is loosing net energy and the emission temperature T is gradually decreasing with time at a rate proportional to the power per unit area difference:
Pa - Pn = [(Ho Ac / As)(1 - Fr) - Ft Cb T^4]
divided by the effective heat capacity per unit area.
Then:
[(1 - Fr) / Ft] < (Cb As / Ho Ac) T^4
and the blue line is below the red line. Hence a point on the red line spontaneously gradually moves to the left toward a lower temperature. This movement continues until a steady state point is reached as indicated by a bold blue dot.
Define:
Tr = thermal runaway temperature
= temperature at the unstable intersection of the blue and red lines.
For:
T < Tr
the system will attempt to converge to the left hand bold blue dot.
For:
T > Tr
the system will attempt to converge to the right hand bold blue dot.
The difference in temperature between the two bold blue dots on Figure 1 is:
287.5 deg K - 270 deg K = 17.5 deg K
Note that if the CO2 concentration is high causing the Ft value to be low and/or if the Fr value is low the blue line defined by:
[(1 - Fr) / Ft] versus T may not have a low temperature intercept with the red line aand the system will only converge to the high temperature intercept, corresponding to thermal runaway.
THERMAL RUNAWAY:
The rapid increase in Bond albedo as Earth's emission temperature T rises through the freezing point of water at:
To = 273.15 K
in combination with infrared radiative power emission proportional to T^4 leads to Earth's energy balance equations having two separate locally stable steady state emission temperature Tsolutions . These two solutions are referred to herein as Tc for the "cool" state solution and Tw for the "warm" state solution. These separate solutions indicate the existence of a spontaneous thermal runaway transition between Tc and Tw.
THERMAL RUNAWAY MECHANISM:
Doubling Earth's atmospheric CO2 concentration will cause the average Earth emission temperature to rise by about 3 degrees C. There will be about another 1 degree C emission temperature rise due to the corresponding increase in water vapor concentration in the upper atmosphere. The problem is that this 4 degree C rise in average Earth emission temperature will significantly reduce Earth's planetary Bond Albedo Fr, thus causing cause a large increase in average Earth emission temperature. The increase in average Earth emission temperature will further reduce Earth's planetary Bond Albedo. This feedback mechanism, known as thermal runaway, will run until there is no more white cloud or surface ice.
PARAMETER VALUES:
Earth's atmospheric "cool" state is characterized by an infrared radiation emission temperature Tc, as seen from outer space, of less than To = 273.15 K.
Earth's "warm" state is characterized by an infrared radiation emission temperature, as seen from outer space, of greater than 273.15 K.
Near an emission temperature of 273.15 K the local Bond albedo drops from about 0.5 to as low as 0.035 over the ocean. There is also a drop in infrared emissivity.
Recall that in general:
[(1 - Fr)) / Ft] = (Cb / Po) T^4 + [(Pa - Pn) As / (Ho Ac Ft)]
or
[1 / Ft] [1 - Fr - ((Pa - Pn)As / Ho Ac)] = [(Cb / Po) T^4]
or
giving the value of Ft in November 1996 as:
Ft = [1 - Fr - (Pa - Pn)As / Ho Ac)] / [(Cb As / Ho Ac) T^4]
= [1 - 0.297 - (Pa / Po)] / [(5.6697 X 10^-8 W / m^2-K^4 (270.0 K)^4) /341.75 W / m^2]
=0.7555
Hence:
(0.7555)[(5.6697 X 10^-8 W / m^2-K^4) (270.0 K)^4) / 341.75 W / m^2] = [1 - 0.297 - (Pa / Po)]
or
(Pa / Po) = 1 - 0.297 - (0.7555)[(5.6697 X 10^-8 W / m^2-K^4 (270.0 K)^4) / 341.75 W / m^2]
= 0.703 - 0.6661
= .0369
Hence:
Pa = .0369 (341.75 W / m^2)
= 12.61 W / m^2
In summary, about 3.69% of the incident solar power is captured as net absorbed heat.
FIX NUMBERS ABOVEPa can be used to calculate the rate of enthalpy gain by the oceans that pertained in the year 2000.
RATE OF ENTHALPY GAIN BY THE OCEANS:
The solar power absorbed by planet Earth is:
Pa 4 Pi Re^2
Recall that:
2 Pi Re = 40,000 km
or
Re = (4 X 10^7 m / 2 Pi)
Thus the net rate of enthalpy gain is:
Pa 4 Pi Re^2 = Pa (4 Pi)(4 / Pi^2) X 10^14 m^2
= 12.61 W / m^2) (16 / Pi) X 10^14 m^2
= 64.2222 X 10^14 W
OCEAN VOLUME:
The surface area of the oceans is about 361 X 10^6 km^2. The average ocean depth is about 3711 m. Hence the ocean volume is about:
361 X 10^6 km^2 X 10^6 m^2 / km^2 X 3.711 X 10^3 m
= 1339.67 X 10^15 m^3
RATE OF AVERAGE OCEAN TEMPERATURE RISE
If we neglect the melting of the polar icecaps the rate of ocean surface temperature rise is limited by the volume of the ocean.
Assume that the ocean maintains its existing temperature profile with depth and uniformly warms.
The rate of temperature rise is given by:
[64.2222 X 10^14 W X 1 J / W - s X 1 cal / 4.18 J X 1 gm deg C / cal X 10^-6 m^3 / gm X 3600 s / hr X 8766 hr / year]
/ 1339.67 X 10^15 m^3
= [(64.2222 / 4.18) X 3.6 X 8.766 X 10^14 deg C m^3 / year] / 1339.67 X 10^15 m^3
= (0.03619) deg C / year
This is a significant rate of ocean warming. This rate of warming is projected to increase about 5 fold during the coming decades.
HENCE WE ARE ALREADY IN THERMAL RUNAWAY. The issue today is whether we are so far into it that reversing it is impossible. To reverse thermal runaway we must reduce the atmospheric CO2 concentration sufficiently to cause Earth to net emit energy rather than net absorb energy. It is presently uncertain as to whether that is possible.
At an average ocean warming rate of about 0.1 degrees C per year in 100 years the emission temperature will increase about 10 degrees C. That will likely be enough to end human life as we presently know it.
WATER:
The triple point of water is at:
273.16 degrees K at a ambient pressure of 6 millibars.
The freezing point of water is at:
273.15 degrees K = 0.00 degrees C at an ambient pressure of one atmosphere (1 bar).
Hence at steady state the temperature at which dominant clouds change from being composed of microscopic ice crystals to being composed of water droplets is in the narrow range 273.15 K to 273.16 K and is almost independent of ambient pressure and hence of cloud altitude and cloud latitude. This issue is illustrated on the phase diagram shown in Figure 4.
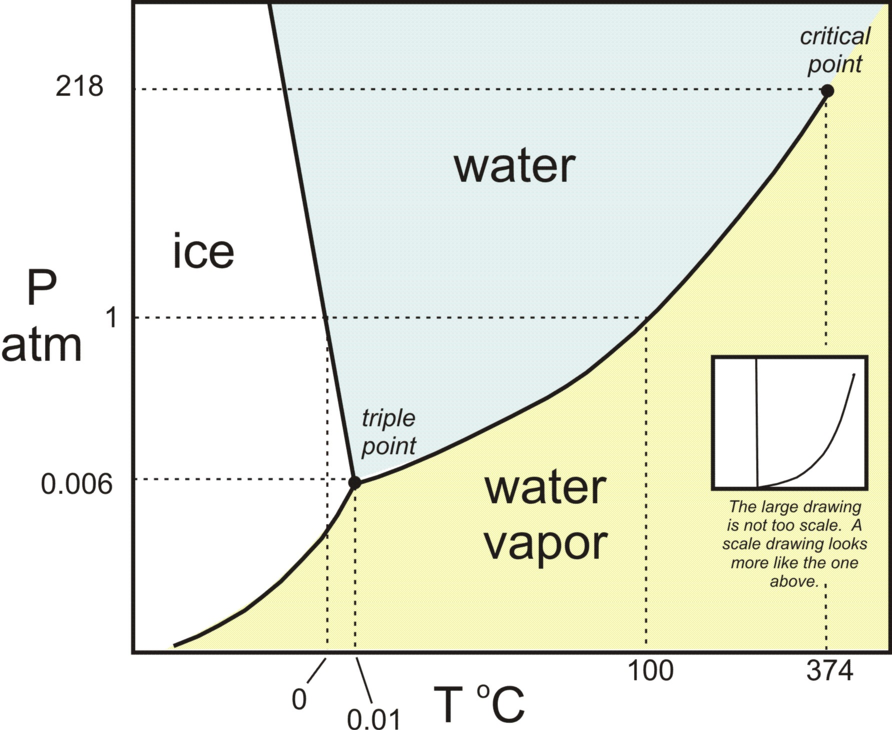
Figure 4 - H2O Phase Diagram
The average temperature difference (273.15 K - 270.0 K) = 3.15 K drives the dominant infrared emission reaction forward at a rate sufficient to balance the absorbed solar radiation power.
SUMMARY:
Non-linearity in the radiant energy balance equations causes Earth to have two locally stable temperature states, a "cool" state and a "warm" state. The non-linearity arises from:
a) A step change in the solar reflectance of water at 273.15 K where there is a solid-liquid phase transition;
b) Preferential infrared radiation emission by water at its liquid-solid phase transition;
c) Infrared power emission approximately proportional to the 4th power of absolute temperature;
d) Earth infrared emissivity dependence on upper atmosphere CO2 concentration;
e) Earth infrared emissivity dependence on atmospheric water vapor concentration.
As shown in Figure 1 on visible light photographs of Earth from deep outer space the "cool" regions and "warm" regions are readily apparent. The problem is that we are already in thermal runaway. The area of the "cool" regions is shrinking and the area of the "warm" regions is expanding.
CARBON STORAGE CYCLE:
Until the industrial revolution Earth was in its "cool" state. However, natural accumulation over tens of millions of years of weakly bound carbon in fossil fuels has enabled a potential spontaneous transition from the "cool" state to the "warm" state.
When there is sufficient weakly bound carbon a "cool" state to "warm" state transition can be triggered by a geologically rare transient event such as a nearby passing star or by the emergence of a fossil carbon energy harvesting life form (humans) that via combustion of weakly bound carbon cause a further decrease in Earth's infrared emissivity.
In response to a "cool" state to "warm" state transition the ocean warms and releases more CO2 to the atmosphere which further reduces Earth's infrared emissivity trapping Earth in its "warm" state for several hundred thousand years.
Over several hundred thousand years in the "warm" state photosynthesis converts atmospheric CO2 back into weakly bound fossil carbon. The resulting decrease in atmospheric CO2 concentration gradually increases Earth's infrared emissivity and hence enables a future "warm" state to "cool" state transition.
Once a "warm" state to "cool" state transition is enabled it can be triggered by a geologically rare event such as a comet impact or a volcanic erruption that causes a transient increase in Earth's Bond albedo.
In response to a "warm" state to "cool" state transition ocean cooling absorbs further CO2 from the atmosphere which further increases Earth's infrared emissivity. As long as a substantial fraction of Earth is in the "cool" state large land animal life forms such as humans can obtain energy by converting a limited amount of weakly bound fossil carbon back to gaseous CO2. However, too much rapid conversion of weakly bound fossil carbon to gaseous CO2 will eventually enable another spontaneous "cool" state to "warm" state transition.
Once the emission temperature exceeds Tr the thermal runaway cannot be stopped.
Thermal runaway occurred about 55 million years ago. As a result there was a global extinction of large land animals, the polar ice caps completely melted and Earth's ecosystem was disrupted for almost 500,000 years.
THERMAL RUNAWAY DANGER:
It is shown herein that today rapid net energy absorption by Earth's is already occurring. The thermal runaway state transition can only be avoided by an immediate and sustained reduction in Earth's atmospheric CO2 concentration. Otherwise thermal runaway will occur and over about 150 years Earth's average emision temperature will rise by as much as 17.5 degrees K.
In spite of the fact that science of thermal runaway is well understood by senior physicists and the remedies are well understood by senior engineers, the reality of thermal runaway is not being seriously addressed by elected politicians. The atmospheric CO2 problem is global in nature and requires expensive solutions with international implementation and international enforcement. Elected politicians with authority to implement these solutions respond only to voters, who with few exceptions know nothing about the relevant science and engineering matters and who fail to take personal responsibility for their own fossil CO2 emissions.
The simple reality is that absent strong leadership and effective action thermal runaway will simply run out of control. As a result of thermal runaway large land animals (including humans) will become extinct, Earth's polar ice caps will melt and the environmental conditions on Earth will be radically changed for several hundred thousand years.
THERMAL RUNAWAY AVOIDANCE:
The only way to halt thermal runaway is for both voters and politicians to place their trust in senior scientists and senior engineers. Understanding thermal runaway involves an advanced understanding of quantum mechanics, radiative energy exchange, non-linear differential equations and control system stability. Halting thermal runaway involves immediate widespread application of fast neutron nuclear power reactors, electricity generation/transmission/distribution systems and related technologies.
Presently mankind is emitting fossil CO2 to the atmosphere faster than the ocean can absorb that CO2. Halting thermal runaway by reducing the atmospheric CO2 concentration requires as a minimum an immediate 90% reduction in total world wide fossil CO2 emissions. Fossil fuels must be left in the ground and must be immediately replaced by renewable and nuclear energy. At the present time elected politicians are unwilling to face these simple realities, so the future prospects for the human species are very dim.
The problem with intermittant renewable energy sources such as wind, solar and run-of-river hydro is that in most jurisdictions they do not provide sufficient energy when and where required to support urban human populations. In most jurisdictions the combined costs of harvesting, transmitting, storing and retransmitting renewable energy to urban load centers are prohibitive. Hence mankind must rely heavily on nuclear energy.
At the heart of the CO2 / thermal runaway problem lies inadequate public education in the physical sciences. It should be possible to halt thermal runaway through prompt widespread application of fast neutron reactors and related technologies for displacement of fossil fuels. However, the voting public has little or no understanding of these technologies and has an irrational fear of nuclear energy. Moreover, voters are constantly misled by deceptive advertisements funded by the fossil fuel industry.
Hope for mankind lies primarily in rigorously enforced reduction of CO2 emissions combined with an immediate world wide expansion of nuclear electricity generation and related electricity transmission/distribution. Renewable energy, while helpful, can at best economically supply only about one third of the total energy required for displacement of fossil fuels.
During the three year period between 1942 and 1945, with the aid of World War II priorities, my grand parents generation took nuclear reactor technology from a scientific concept to breeding enough Pu-239 and isolating enough U-235 for three functional atomic bombs. If mankind is to avoid thermal runaway a similar priority must be assigned to construction of new liquid sodium cooled fast neutron nuclear power reactors and related electricity generation/transmission/distribution. To meet the time constraints many elements of the existing pre-construction licensing processes and other legal and administrative obstacles to rapid construction of nuclear power reactors and electricity transmission lines must be set aside.
PREVIOUS THERMAL RUNAWAY:
The geologic record shows that about 55 million years ago, during a 200,000 year period known as the PETM (Paleocene Eocene Thermal Maximum), analogous atmospheric CO2 triggered thermal runaway caused complete melting of the polar ice caps and caused a global extinction of all large land animals. A further 300,000 years passed before the Earth returned to normal. Isotopic analysis of PETM sediments confirms that Earth has at least two locally stable emission temperature states, a "cool" state and a "warm" state.
PLANETARY BOND ALBEDO MONITORING:
It would be prudent for the National Research Council of Canada to implement or supervise a program for ongoing monitoring of Earth's Bond albedo to an absolute accuracy of three significant figures and to report the results annually to the Canadian public.
The Bond albedo can be determined by measurement of the ratio of the intensity of Earthshine reflected from the moon to direct solar illumination reflected from the moon.
THERMAL RUNAWAY:
Thermal runaway occurs when the conditions for stability in Earth's "cool" state are no longer met. This will happen at an Earth average emission temperature of less than 273.15 degrees K. In these circumstances Earth's average emission temperature will spontaneously drift toward the locally stable "warm" state. The commencement of thermal runaway is imperceptible. However, as thermal runaway progresses Earth's infrared emission temperature will rise faster and faster until the Canadian winter becomes like the present Canadian summer and the Canadian summer becomes like the present equatorial climate.
The theoretical average Earth emission temperature rise associated with thermal runaway is 17.5 K. The near term temperature rise is somewhat less due to the long thermal response time of the oceans.
When thermal runaway become obvious Canada will face uncontrollable immigration from the USA, Mexico and Central America. Parts of Canada's major sea port cities, such as Vancouver's Fraser River Delta and surrounding communities, will quickly be submerged by the rising sea level.
RISK:
The Earth continuously absorbs a fraction of incident solar radiation and continuously emits infrared radiation. At steady state conditions the absorbed solar power equals the emitted infrared power so that the Earth's net energy change is zero. However, today we are not at steady state conditions. There is a non-equilibrium concentration of CO2 in the Earth's atmosphere that is causing net energy absorption by the oceans. This net energy absorption in combination with a decreasing infrared emissivity due to an increasing atmospheric CO2 concentration is causing Earth to gradually move toward the thermal runaway threshold.
If the present high atmospheric CO2 concentration persists cumulative net energy absorption by the oceans will melt sufficient polar ice to cause thermal runaway. Escape from thermal runaway is only possible in the very near term and then only via an immediate major reduction in the Earth's atmospheric CO2 concentration and / or via an immediate major increase in the Earth's Bond albedo. Neither of these two physical objectives is easy to achieve.
Earth's thermal infrared radiation emission spectrum exhibits a well defined emission temperature outside the GHG absorption bands. An emission temperature of:
T = 270.0 degrees K
was measured in November 1996 from deep space by a far infrared spectometer (Thermal Emission Spectrometer) on board the Mars Global Surveyor spacecraft.
The infrared radiation that presently cools Earth is primarily emitted by microscopic water droplets in the atmosphere during liquid-solid phase transitions.
In November 1996 the Earth's atmospheric CO2 concentration, as measured at Mona Loa, Hawaii, was about 360.76 ppmv.
EFFECT OF CO2 INJECTION:
Combustion of fossil fuels causes a transient increase in atmospheric CO2 concentration. At present ocean temperatures the transient CO2 in the atmosphere has a half life of about 11 years.(Ref:CARBON DIOXIDE RETENTION TIME)
The increased concentration of CO2 in the Earth's upper atmosphere reduces Earth's far infrared emissivity. This effect causes global warming which raises the "cool" state emission temperature Tc.
Define:
Tr = emission temperature at commencement of Thermal Runaway.
Fr = Earth bond albedo
= fraction of incident solar radiation that is reflected into space
For T > To the formation rate of solar light reflecting ice micro-crystals rapidly diminishes. Hence, as the atmospheric CO2 concentration increases Fr decreases and the Earth transitions from its "cool" state into its "warm" state.
In the "warm" state ocean warming causes an increase in the steady state atmospheric CO2 concentration. If there is sufficient ocean warming the Earth will be trapped in its "warm" state long after the initial transient fossil CO2 concentration decays. The Earth will remain trapped in its "warm" state for hundreds of thousands of years until photosynthesis and carbonate rock formation remove enough CO2 from the ocean-atmosphere pool to enable a "warm" state to "cool" state transition.
A "cool" state to "warm" state transition is accompanied by an increase in Earth's infrared emission temperature T of about 17.5 degrees C and is accompanied by a decrease in the Earth's Bond albedo Fr from ~ 0.30 to ~ 0.10.
WARM STATE TO COOL STATE TRANSITION:
After ocean temperature stabilization in the "warm" state over hundreds of thousands of years photosynthesis by plants converts CO2 in the ocean-atmosphere pool into fossil carbon. Eventually photosynthesis and carbonate rock formation in the "warm" state will cause a sufficient drop in the amount of CO2 in the ocean-atmosphere pool (and hence in the atmospheric CO2 concentration) to enable Earth to transition from its "warm" state back to its "cool" state. Once thattransition is enabled a cooling event such as a Milankovich cycle will cause a "warm" state to "cool" state transition.
EARTH CLIMATE STATUS:
At any instant in time the Earth has a characteristic value of infrared emission temperature T, which at steady state defines the present climate. At any instant in time the Earth has a characteristic value of (dT / dt), where t = time, which allows limited projections regarding the climate in the future.
At steady state conditions (dT / dt) = 0 so we can reliably conclude that the future climate will be very similar to the present climate.
In circumstances in which there is known ongoing climate change an issue of great importance in public policy is projecting the future emission temperature at which the climate change will stop. Such projections can be made by taking advantage of known mathematical stability criteria. These same stability criteria can be used to warn us when the Earth is approaching a dangerously unstable situation, such as triggered the PETM.
DETERMINATION OF Ft:
At steady state conditions in the "cool: state:
{[(1 - Fr) / Ft]|T = Tc} = (Cb / Po) Tc^4
or
[{([(Tc / To)^Kf] - 1) / (10([(Tc / To)^Kf] + 1))} + 0.803] / Ft = (Cb / Po) Tc^4
At T = Tc the quantity:
[(Tc / To)^Kf] << 1
giving:
0.703 / Ft = (Cb / Po) Tc^4
DATA ANALYSIS:
Find net the absorbed power:
The energy balance equation gives:
{[(1 - Fr) / Ft]|T = Ta} = (Cb / Po) Ta^4 + [Pa / (Po Ft)]
Evaluation of this equation at:
Ta = 270 deg K,
Po = 341.75 W / m^2
(Pa / Po) =
Ft = 0.7555
Fr|270 K = 0.297
(Cb / Po) Ta^4 = [(5.6697 X 10^-8 W / m^2-K^4) / (341.75 W / m^2)][270.0 K]^4
= 0.8816711156
[(1 - Fr) / Ft] = [(1 - 0.297) / 0.7555]
= 0.9305095963
Hence:
[Pa / Po] = Ft [0.9305095963 - 0.8816711156]
= 0.7555 [.0488384807]
= 0.0368974722
Find the change in [(1 - Fr) / Ft] due th the change in CO2 concentration from preindustrial times to 1996.
Thus at the stable "cool" state temperature Tc we have the equation:
[0.703 / Ft]|Tc = 0.8816711156
or
Ft = 0.703 / 0.8816711156
= 0.7973494737
Note that Ft is dependent on the atmospheric CO2 concentration. Changing the atmospheric CO2 concentration changes Ft which can cause a change in state.
Absent ocean warming the ratio [(1 - Fr) / Ft] varies from:
.703 / .7973494737 = 0.8816711156 in the "cool" state to:
0.903 / .7973494737 = 1.132502158 in the "warm" state.
The corresponding November 1996 graphs of [(1 - Fr) / Ft] versus T and [(Cb / Po) T^4] versus T are shown on Figure 7 for Ft = 0.7973494737. The "cool" state temperature was 270.0 K. The potential "warm" state temperature was 287.4 K. The atmospheric CO2 concentration was 360.76 ppmv.
NOVEMBER 1996
Figure 7
Note that in November 1996 the Earth was still in a safe stable state.
LOW TEMPERATURES:
As the emission temperature T decreases below the "cool" state temperature Tc the ocean surface progressively freezes. Today the average ocean surface temperature is about 15 degrees C which is about 18 degrees K above the "cool" state emission temperature. Hence if the emission temperature fell more than 18 degrees K below Tc the ocean surface would freeze and the planetary albedo of the Earth would increase to about 0.5.
Hence as the emission temperature T rises from 230 K to 270 K the Bond albedo decreases from about 0.50 to about 0.30. At T = 273.15 K the bond albedo rapidly falls from 0.30 to 0.10 and then remains almost constant at higher temperatures.
Thus the change in bond albedo has two main step components. One step is associated with a solid-liquid phase change of melting ice on the ocean surface. The other step is associated with the solid-liquid phase change of ice micro-crystals in clouds. Typically the average temperature on the Earth's surface is about 18 degrees K higher than the Earth emission temperature. Hence, much of the ocean surface will be frozen at:
T = To - 18 K
= 252 K.
At T = 270 K only near the poles does floating ice remain on the Earth's surface. The ice micro-crystals in clouds change to liquid water at:
T = 273.15 K.
GRAPHICAL SOLUTION FOR T:
The practical way to find solutions for T is to superimpose two graphs. Using a red line plot:
(Cb / Po) T^4 + [Pa / Po Ft)] vs T.
Using a blue line plot [(1 - Fr) / Ft] vs T for:
[dFr|T = 273.15 K] = - 0.200
and for
[dFr|T = 252 K] = - 0.200
Define:
To = 273.15 K
= freezing point of water
Toc = 270.0 K - 18.0 K
= 252.0 K
For T < Toc the blue line is given by:
[(1 - Fr) / Ft] = [(1 - .497) / 0.7973494737]
= 0.6308400728
For Toc < T < To the blue line is given by:
[(1 - Fr) / Ft] = [(1 - .297) / 0.7973494737]
= 0.8816711156
For T > To the blue line is given by:
[(1 - Fr) / Ft] = [(1 - .097) / 0.7973494737]
= 1.132502158
At the points where the red and blue graph lines intersect are steady state points at which the Earth's net energy change per unit time is zero. These points are at (248.5 K, 0.63084), (270.0 K, 0.88167) and (287.4, 1.13250). Thus:
Tc = 270.0 K
and
Tw = 284.4 K
The emission temperature rise due to thermal runaway is:
(Tw - Tc) = 284.4 K - 270.0 K
= 14.4 K
The choice of dFr = - 0.200 is based on a measured "cool" state value of:
[Fr|T = Tc] = 0.297
a known "frozen" state value of:
[Fr|T =Tf] = [Fr|T = Tc] + 0.2
= 0.497
and a known "warm" state value of:
[Fr|T = Tw] = [Fr|T = Tc] - 0.2
= 0.097
These Fr values come from measurements of planetary albedo, measurements of local albedo and solar illumination photographs of the Earth from space.
As shown on Figure 3, these superimposed plots intersect at up to five emission temperatures. The lowest of these emission temperatures is the locally stable frozen state temperature Tf. The middle emission temperature is the locally stable "cool" state temperature Tc. The highest of these emission temperatures is the locally stable "warm" state temperature Tw. The emission temperatures Tf, Tc and Tw are indicated on the graph by bold blue dots. In between the locally stable temperature states are unstable temperature states at 252 K and at 273.15 K which are indicated by vertical dotted blue lines. In this simple mathematical model the Earth emission temperature at commencement of thermal runaway is 273.15 K.
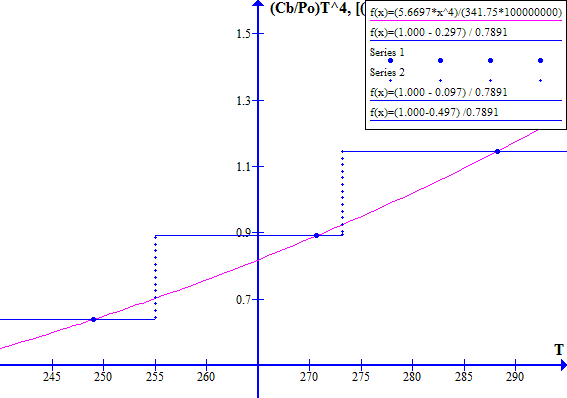
Figure 3
Note that if the blue lines rise with respect to the red line, as will happen with an increased atmospheric CO2 concentration that reduces Ft, then the only stable state is the "warm" state and the Earth reaches the "warm" state via thermal runaway.
The change in local albedo with temperature, the PETM O-18 / O-16 ratio data, the PETM C-13 / C-12 ratio data, and fossil data all confirm that the existence of two locally stable temperature states and hence thermal runaway.
We currently live in the "cool" state. The practical issues that we face are accurate determination of the atmospheric CO2 concentration at which thermal runaway will occur and the magnitude of the temperature rise (Tw - Tc) associated with thermal runaway.
PRE-INDUSTRIAL, PRESENT AND FUTURE GRAPHS:
The corresponding pre-industrial, present and future graphical solutions can be found by using the relevant atmospheric CO2 concentrations to find the relevant Ft values.
Define:
Tb = steady state emission temperature at recovery from thermal runaway at the atmospheric CO2 concentration Pa;
Tc = steady state emission temperature at pre-industrial atmospheric CO2 concentration of Pb = 280 ppmv;
Ta = 270.0 K = measured emission temperature at the November 1996 atmospheric CO2 concentration of Pc = 360.76 ppmv;
Td = emission temperature at the 2014 atmospheric CO2 concentration of Pd = 400 ppmv;
Tr = 271.50 K = thermal runaway temperature at the atmospheric CO2 concentration of Pr;
To = 273.15 K = freezing point of water;
Te = (Ta + 4.015 K)
= (270.0 K + 4.015 K)
= 274.015 K
= theoretical emission temperature at an atmospheric CO2 concentration of 721.52 ppmv if there is no change in planetary albedo
Tw = steady state warm state temperature
Note that:
Tb < Tc < Ta < Tr < To
Fr.
Reference: GLOBAL WARMING
P = atmospheric CO2 concentration at steady state temperature T
Pb = atmospheric CO2 concentration at recovery from thermal runaway T
Pd = atmospheric CO2 concentration in 2014 = 400 ppmv
Pr = atmospheric CO2 concentration at thermal runaway trip point
Pa = atmospheric CO2 concentration at temperature Ta in the "cool" state in November 1996.
Pe = 2 Pa
Note that:
Pb < Pa < Pd < Pe
Ft = emissivity
Ftc = emissivity at atmospheric CO2 concentration Pa = 280 ppmv;
Fta = emissivity at atmospheric CO2 concentration Pc = 360.76 ppmv;
Ftd = emissivity at atmospheric CO2 concentration Pd = 400 ppmv;
Ftr = emissivity at atmospheric CO2 concentration Pr;
Fte = emissivity at atmospheric CO2 concentration Pe = 2 Pa = 721.52 ppmv;
Note that:
Ta < Tb < Tc < Td < Tr < To < Te
CO2 PRESSURE DEPENDENCE OF Ft:
Note that for T in the range:
Tb <= T <= Tc
Fr is constant.
At steady state conditions in circumstances of constant Fr:
Fta Cb Ta^4 = Ft Cb T^4
Hence:
Fta / Ft = (T / Ta)^4
FIND DEPENDENCE OF Ft ON CO2 CONCENTRATION:
We know that for:
Ta = 270.0 K, Pa = 360.76 ppmv
and for:
Pe = 2 Pa
= 2 (360.76 ppmv)
= 721.52 ppmv
Te = (270.0 K + 4.015 K) = 274.015 K
Note that if the Earth's atmospheric CO2 concentration doubles there is about a 6.0% decrease in Ft which causes an emission temperature increase is about 4.015 K. Reference: GLOBAL WARMING.
Hence:
(Te / Ta) = (274.015 / 270.0)
= 1.01487037
= (Pe / Pa)^(Ki)
Thus:
(Pe / Pa) = (Te / Tc)^(1 / Ki)
or
(Pe / Pa) = [(Fta / Fte)^0.25]^(1 / Ki)
Ln(Pe / Pa) = Ln[(Fta / Fte)^(1 /4 Ki)]
= (1 / 4 Ki) Ln[Fta / Fte]
= (1 / 4 Ki) Ln[(Te / Ta)^4]
= (1 / Ki) Ln[(Te / Ta)]
Thus:
Ln(2) = (Ln[(274.015 /270.0)] / Ki)
or
Ki =[1 / (Ln(2))]Ln[(274.015 /270.0)]
= [1 / 0.6931471806][.0147608901]
= 0.0212954629
In general:
Ln(P / Pa) = (1 / 4 Ki) Ln[Fta / Ft]
or
(P / Pa) = Exp{(1 / 4 Ki) Ln[Fta / Ft]}
= Exp{[1 / (4 X 0.0212954629)] Ln[Fta / Ft]}
= Exp{11.73958984 Ln[Fta / Ft]}
Hence:
P = Pa Exp{11.73958984 Ln[Fta / Ft]}
which equation relates CO2 partial pressure P to emissivity Ft under circumstances of constant bond albedo Fr.
This equation can be rearranged to give:
Ln(P / Pa) = {11.73958984 Ln[Fta / Ft]}
or
Ln[Fta / Ft] = [Ln(P / Pa)] / 11.73958984
or
Fta / Ft = Exp{[Ln(P / Pa)] / 11.73958984}
or
Ft = Fta / Exp{[Ln(P / Pa)] / 11.73958984}
DATA ANALYSIS:
Find net the absorbed power:
The energy balance equation gives:
{[(1 - Fr) / Ft]|T = Ta} = (Cb / Po) Ta^4 + [Pa / (Po Ft)]
Evaluation of this equation at:
Ta = 270 deg K,
Po = 341.75 W / m^2
Fta = 0.7555
Fr|270 K = 0.297
Cb = 5.6697 X 10^-8 W / m^2-K^4)
(Cb / Po) Ta^4 = [(5.6697 X 10^-8 W / m^2-K^4) / (341.75 W / m^2)][270.0 K]^4
= 0.8816711156
Fa = [(1 - Fr) / Ft]
= [(1 - 0.297) / 0.7555]
= 0.9305095963
Hence:
[Pa / Po] = Ft [0.9305095963 - 0.8816711156]
= 0.7555 [.0488384807]
= 0.0368974722
FIND Ftc = PRE-INDUSTRIAL VALUE OF Ft:
For Fta = 0.7555 @ Pa = 360.76 ppmv, 270 K;
the corresponding pre-industrial vluea are:
Pc = 280 ppmv, Pa = 0, Ftc = _______
Fa - [Pa /Po Ft)] - Fx
= .9305095 - [0.0368974722 / .7555] - Fx
= 0
Hence:
Fx = Fa - [Pa /Po Ft)]
= .9305095 - [0.0368974722 / .7555
= 0.8816710193
Fx = (Cb / Po) Ta^4
and
Fc = (Cb / Po) Tc^4
giving:
Fc / Fx = (Tc / Ta)^4
or
Fc = Fx (Tc / Ta)^4
= 0.8816710193 (Tc / Ta)^4
Recall that:
Ft = Fta / Exp{[Ln(P / Pa)] / 11.73958984}
or
Ftc = Fta / Exp{[Ln(Pc / Pa)] / 11.73958984}
= 0.7555 / Exp{[Ln(280 / 360.76)] / 11.73958984}
= 0.7555 / 0.978644266
= 0.7719863348
Thermal runaway will occur when:
T > Tr
where:
(Cb / Po) Tr^4 = (1 - Fra) / Fta
or
Tr^4 = (Po / Cb) (1 - Fra) / Fta
= [(341.75 W / m^2) / (5.6697 X 10^-8 w / m^2-K^4)][.703 /.7555]
= 56.0879155 X 10^8 K^4
or
Tr = 273.6637822 K
Ftc = Fta / Exp{[Ln(Pc / Pa)] / 11.73958984}
= 0.7555 / Exp{[Ln(280 / 360.76)] / 11.73958984}
= 0.7555 / 0.978644266
= 0.7719863348
For a the pre-industrial atmospheric CO2 concentration of 280 ppmv:
Ftc = 0.7719863348
PREINDUSTRIAL VALUES:
Recall that:
[(1 - Fr) / Ft] = (Cb / Po) T^4 + [Pa / (Po Ft)]
At our known data point:
[(1 - Fra) / Fta] = (Cb / Po) Ta^4 + [Pa / (Po Ft)]
In preindustial times:
Pa = 0
and Ft was larger due to a smaller atmospheric CO2 concentration.
Hence:
[(1 - Frc) / Ftc] = (Cb / Po) Tc^4
or
Tc^4 = (Po / Cb)[(1 - Frc) / Ftc]
Assume that:
Frc = Fra = 0.297
Then:
Tc^4 = (Po / Cb)[(1 - Fra) / Ftc]
= (Po / Cb)[(1 - Fra) / Fta] {Fta / Ftc]
= [(341.75 W / m^2 )/ 5.6697 X 10^-8 W / m^2-K^4)][(1 - 0.297) / 0.7555][0.7555 / 0.7719863348]
= [(341.75 W / m^2 )/ 5.6697 X 10^-8 W / m^2-K^4)][.703 / 0.7719863348]
= 54.8901169 X 10^8 K^4
This preindustial temperature will be reduced if [(dFr / dT)|T = Ta] < 0
Recall that at steady state: (1 - Fr) / Ft = (Cb / Po) T^4
If at steady state the CO2 concentration is constant, then Ft is constant. Hence:
(Tw / Tc)^4 = (1 - Frw) / (1 - Frc)
or for a 0.20 reduction in Fr with increasing temperature, provides a corresponding locally stable "warm" state temperature:
Tw = Tc [(1 - Frw) / (1 - Frc)]^0.25
or
Tw = 272.1908607 [0.903 / .703]^0.25
= 289.772 degrees K
The corresponding graphs of [(1 - Fr) / Ft] versus T and [(Cb / Po) T^4] versus T are shown on Figure 5.
FIX THE FOLLOWING GRAPHPRE-INDUSTRIAL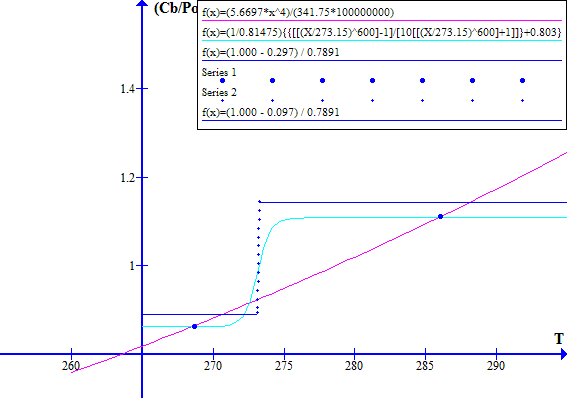
Figure 5
Until the 20th century the Earth was thermally stable at a "cool" state infrared emission temperature of about:
Tc = 272 K.
FIND Ftd - 2014 VALUE OF Ft:
For Fta = 0.7555, Pa = 360.76 ppmv, Pd = 400 ppmv
Ftd = Fta / Exp{[Ln(Pd / Pa)] / 11.73958984}
= 0.7555 / Exp{[Ln(400 / 360.76)] / 11.73958984}
= 0.7555 / 1.008833956
= 0.7488843883
The Earth reached this Ft value in 2014.
The decrease in Ft due to the higher atmospheric CO2 concentration increases Tc to Tcd and increases Tw to Twd. The formla is:
Ftc / Ftd = (Tcd / Tc)^4
or
Tcd = Tc [Ftc / Ftd]^0.25
= 268.5467978 [0.7719863348 / 0.7488843883]^0.25
= 268.5467978 [1.007624478]
= 270.5943 degrees K
and for this higher atmospheric CO2 concentration:
Twd = Tcd [(1 - Frw) / (1 - Frc)]^0.25
= 270.5943 degrees K [(1 - Frw) / (1 - Frc)]^0.25
= 270.5943 degrees K [(.903) / (,703)]^0.25
= 270.5943 [1.064591774]
= 288.072466 degrees K
As shown in Figure 6 in 2014 the atmospheric CO2 concentration was just below the threshold for commencement of thermal runaway.
CHECK THIS FIGURE
2014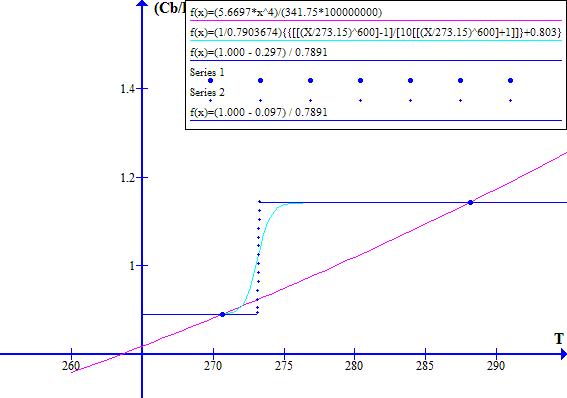
Figure 6
FIND THE VALUE OF [(1 - Fr) / Ft] AT COMMENCEMENT OF THERMAL RUNAWAY:
For Fta = 0.7555 and Ftr = 0.7850
Recall that:
Pr = Pa Exp{11.73958984 Ln[Fta / Ftr]}
= 360.76 ppmv Exp{11.73958984 Ln[.7555 / .7850]}
= 433.312 ppmv
As shown on Figure 7 at Ftr = 0.7850 there is a spontaneous transition from the "cool" state to the "warm" state known as thermal runaway. The only stable temperature is in the "warm" state at T = 288.7 K.
THERMAL RUNAWAY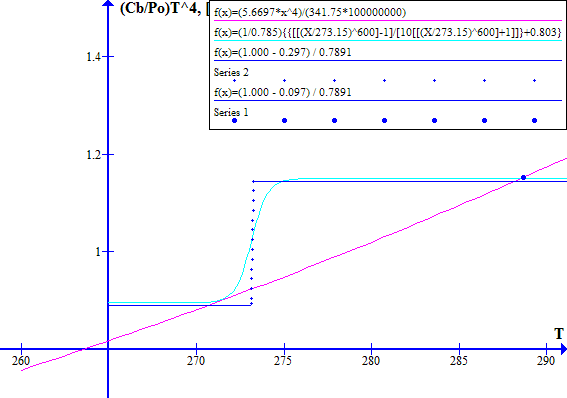
Figure 7
The Earth is projected to reach the calculated thermal runaway atmospheric CO2 concentration by the year 2027.
Whether or not thermal runaway is avoided will depend on atmospheric CO2 concentration reductions actually achieved in the very near future and on possible small errors in the experimental measurements of Tc and Fr.
DETERMINATION OF Tr:
The instability temperature at T = Tr lies on the steady state line. Hence:
{[(1 - Fr) / Ft]|T = Tr} = (Cb / Po) Tr^4
or
[{([(Tr / To)^Kf] - 1) / (10([(Tr / To)^Kf] + 1))} + 0.803] / Ft = (Cb / Po) Tr^4
The practical way to solve this equation for Tr is graphically. The above graphs indicate a thermal runaway temperature of 271.5 K.
Note that under an accurate calculation the emission temperature:
Tr ~ 271.5 K
at which thermal runaway commences is significantly less than:
To = 273.15 K.
Hence the CO2 partial pressure at which thermal runaway commences is substantially less than is indicated by a simple calculation based on the assumption that thermal runaway commences at emission temperature:
T = To
= 273.15 K.
Examination of the above graphs shows that any further reduction in the value of Ft caused by increasing the atmospheric CO2 concentration will trigger thermal runaway.
FIND VALUE OF [(1- Fr)] / Ft] REQUIRED TO RECOVER FROM THERMAL RUNAWAY:
Increasing the value of Ft to about 0.95 would enable a "warm" state to "cool" state transition.
For Ftc = 0.7973494737 and Fta = 0.95
Recall that:
Pa = Pc Exp{11.73958984 Ln[Ftc / Fta]}
= 360.76 ppmv Exp{11.73958984 Ln[.7973494737 / .95]}
= 46.15 ppmv
This is the low atmospheric CO2 concentration that must be achieved for the Earth to recover from the "warm" state.
As shown on Figure 8 at Ft = 0.95 the only stable temperature is at Tc = 258.7 K and there is a spontaneous transition from the "warm" state to the "cool" state.
RECOVERY FROM THERMAL RUNAWAY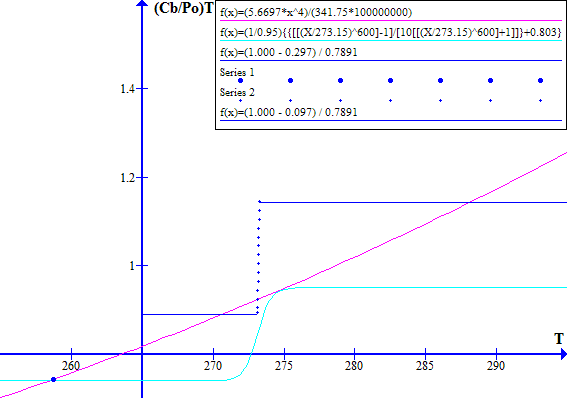
Figure 8
Note that at commencement of thermal runaway Ft = 0.785 and at recovery from thermal runaway Ft = 0.95. Achieving this Ft change requires about a (Pr / Pa) ratio of about:
(Pr / Pa) = (433 / 46.15)
= 9.4 fold
change in atmospheric CO2 concentration. The recovery process is aided by a companion reduction in atmospheric water vapor concentration which also affects Ft. Even so, recovery from thermal runaway will require hundreds of thousands of years for photosynthesis to convert CO2 that has accumulated in the ocean-atmosphere pool back into fossil carbon.
It is theoretically possible that the change in Fr is only - 0.10 instead of - 0.20. That reduced value of dFr would cause proportionately more closely spaced Ft extremes and would proportionately reduce the temperature difference (Tw - Tc). The corresponding change in atmospheric CO2 concentration required to recover from thermal runaway would be about 3 fold.
GRAPH DISCUSSION REVIEW:
1) At any instant in time the emission temperature of the Earth is represented by a point on the red line.
2) The red line is defined by the equation:
[(1 - Fr) / Ft] = (Cb / Po) T^4
3) Everywhere on the red line the slope of the red line is given by:
4 (Cb / Po) Ta^3
4) In order for a stable "cool" state to exist at T = Tc:
{[(1 - Fr) / Ft]|T = Tc} = (Cb / Po) Tc^4
and
{(d[(1 - Fr) / Ft] / dT)|T = Tc} < 4 (Cb / Po) Tc^3
5) In order for the point of instability to exist at T = Tr:
{[(1 - Fr) / Ft]|T = Tr} = (Cb / Po) Tr^4
and
{(d[(1 - Fr) / Ft] / dT)|T = Tr} > 4 (Cb / Po) Tr^3
6) In order for a stable warm state to exist at T = Tw:
{[(1 - Fr) / Ft]|T = Tw} = (Cb / Po) Tw^4
and
{(d[(1 - Fr) / Ft] / dT)|T = Tw} < 4 (Cb / Po) Tw^3
7) In order for Tc and Tw to be separate:
{[d[(1 - Fr) / Ft] / dT]| Tr} > 4 (Cb / Po) Tr^3
8) The steep slope of [(1 - Fr) / Ft] at To, the freezing point of water, together with the low slopes of [(1 - Fr) / Ft] at temperatures Tc and Tw that are respectively below and above the freezing point of water causes formation of a stable "cool" state at:
T = Tc
below the freezing point of water and a "warm" state at:
T = Tw
above the freezing point of water.
9) At temperatures far from the freezing point of water Fr is nearly constant so that [(1 - Fr) / Ft] is nearly constant.
10) As the ocean temperature increases the ocean emits CO2 causing Ft to gradually decrease. Thus at steady state at temperatures far from the freezing point of water as T increases the ratio:
[(1 - Fr) / Ft]
gradually increases. However, close to the freezing point of water:
[(1 - Fr) / Ft]
rapidly increases.
11) The intersection point between the blue line and the red line at Tc = 270.0 K was measured by the Mars Global Surveyor spacecraft in November 1996. The corresponding value of planetary albedo Fr that was measured during the period 1998 to 2000 was:
Fr = 0.297.
Applying the formula:
(Cb / Po) T^4 = [(1-Fr) / Ft]
gives:
[Ft|Tc = 270.0 K] = (1 - Fr) Po / (Cb Tc^4)
= [(1 - 0.297) (341.75 W / m^2) / ((5.6697 X 10^-8 W / m^2-K^4) X (270.0 K^4))]
= 0.7973494737
12) The corresponding value of [(1 - Fr) / Ft] at Tc = 270.0 K is given by:
[(1 - Fr) / Ft] = [(1 - .297) / 0.7973494737]
= 0.8816711156
13) The freezing point of water at 273.15 degrees K is accurately known and is almost independent of pressure and hence is independent of the altitude of the emitting liquid-solid transitioning water.
14) At steady state the formula:
(Cb / Po) T^4 = [(1 - Fr) / Ft]
implies that at steady state temperature T as compared to steady state temperature Tc:
(T^4 / Tc^4) = {[(1 - Fr) / Ft]|T} / {[(1 - Fr) / Ft]|Tc}
or
{[(1 - Fr) / Ft]|T} = {[(1 - Fr) / Ft]|Tc}(T^4 / Tc^4)
Thus for T = Tr and Tc = 270.0 K:
{[(1 - Fr) / Ft]|Tr = {[(1 - Fr) / Ft]|Tc}(Tr^4 / Tc^4)
= 0.8816711156 (Tr / 270.0)^4
15)For a decrease in Fr of 0.200 between T = Tc and T = Tw:
{[(1 - Fr) / Ft]|Tw} = {[(1 - Fr) / Ft]|Tc}(Tw^4 / Tc^4)
or
{[(1 - Fr) / Ft]|T = Tw} = [(1 - .297) / 0.7973494737] [Tw / 270.0 K]^4
= 1.132502158
Hence:
Tw^4 = [270.0 K]^4 [0.7973494737 / (1 - .297)] [1.132502158]
or
Tw = [270.0 K] {[0.7973494737 / (1 - .297)] [1.132502158]}^0.25
= 287.44 K
Some of the aforementioned topics are detailed below.
THE TREND:
Combustion of fossil fuels injects transient CO2 into the Earth's atmosphere which reduces the Earth's thermal infrared emissivity Ft causing net energy absorption and a gradual increase in emission temperature. Increasing the emission temperature raises the saturation water vapor pressure which further decreases the average emissivity Ft and hence further increases the emission temperature. The increase in emission temperature further decreases the Earth's planetary albedo and hence causes more solar energy absorption.
During the 20th century mankind injected so much transient CO2 into the Earth's atmosphere via combustion of fossil fuels that the Earth's emissivity Ft significantly decreased causing net heat absorption which melted most of the floating polar ice. The atmospheric CO2 concentration is continuing to increase. Over time the ocean temperature will gradually rise causing a further increase in the atmospheric CO2 concentration. When a similar increase in atmospheric CO2 concentration occurred during the Paleocene-Eocene Thermal Maximum (PETM) the Earth was trapped in its "warm" state for over 200,000 years.
If we let thermal runaway continue we are condemning our children to thermal extinction. The ground level temperature rise corresponding to the thermal runaway emission temperature rise is larger than the adaption capability of large land animals..
THERMAL RUNAWAY THRESHOLD TEMPERATURE Tr:
As CO2 is added to the atmosphere the local emission temperature increases due to a decrease in local infrared emissivity Ft. However this temperature increase also causes a decrease in Bond albedo Fr. There is an emission temperature Tr in the range:
270 K < Tr < 273.15 K
where this positive feedback effect triggers a spontaneous change of atmospheric state from the "cool" state to the "warm" state.
From a practical perspective once T > Tr due to positive feedback it will likely be impossible to halt thermal runaway. The exact value of Tr is dependent on the exact shape of the Fr versus T curve. A major concern is hysterisis in this curve due to the residence time of CO2 in the atmosphere.
FEEDBACK IN THERMAL RUNAWAY:
As the atmospheric CO2 concentration increases Ft decreases which causes the steady state value of T to increase. At:
T = 273.15 degrees K
microscopic ice crystals in clouds become liquid water which causes a large decrease in Fr which in turn causes a rapid increase in T. The increase in T tends to increase the atmospheric H2O concentration which further decreases Ft. With increasing ocean water temperature the partial pressure of CO2 over the ocean increases due to the temperature dependence of the chemical reaction:
Ca ++ + 2(HCO3)- = CaCO3 + H2O + CO2
The combination of these effects causes a rapid increase in the ratio:
[(1 - Fr) / Ft]
with increasing temperature at T = 273.15 deg K.
In thermal runaway the Bond albedo will spontaneously decrease and the Earth will switch from its locally stable "cool" state to its locally stable "warm" state. Once thermal runaway is seriously under way there is no practical way to prevent continuation of the state switching process. The "warm" state warms the ocean which emits CO2 and H2O and hence further reduces Ft, which tends to trap the Earth in the "warm" state.
If the quantity of CO2 in the ocean-atmosphere pool is sufficiently large, ocean warming will raise the steady state atmospheric CO2 concentration above the level which will trap the Earth in the "warm" state, even if combustion of fossil fuels is totally stopped. The ocean warming will continue in the "warm" state until stopped by a new steady state balance between solar energy absorption and infrared emission in the "warm" state.
The projected average emission temperature increase, if it is allowed to occur, will cause massive changes in the Earth's natural environment.
It is reasonable to assume that over many decades the 17.5 K increase in emission temperature will result in about a 17 degree K increase in average ocean temperature. Hence a 17.0 K increase in ocean temperature is assumed on the web page titled WARM STATE TRAPPING. This temperature increase quantitatively explains the behavior of the Earth during the PETM.
HALTING THERMAL RUNAWAY:
During thermal runaway emission temperature T will spontaneously rise due to the positive feedback driven changes in Fr. In order to keep the Earth out of the "warm" state fossil CO2 emissions must be stopped now. The biggest threat to mankind as a species is failure of governments to collectively act now to halt thermal runaway. In present circumstances Earth is in acute danger of being trapped in the "warm" state.
CONSEQUENCE OF WARM STATE ON GROUND LEVEL TEMPERATURE:
Note that Tc = 270.0 K is the Earth's emission temperature as seen by an infrared spectrometer mounted in a distant space craft on November 24, 1996. The corresponding mean Earth surface temperature measured in Honalulu, Hawaii on November 24, 1996 was 76.9 F = 24.94 C = 298.09 K. A more typical average Earth surface temperature is 15 C = 288.15 K. Hence the average Earth surface temperature is about 18 K higher than the average emission temperature.
The average emission temperature of:
270.0 + 17.5 = 287.5 K
which likely occurred during the initial PETM transient, caused a daily average Earth surface temperature of:
287.5 K + 18 K = 305.5 K
= 32.35 C
This average Earth surface temperature is too hot for sustaining large animal life. This average temperature may have been raised a few more degrees C by an increased water vapor concentration in the upper atmosphere.
EMAIL EXCERPT:
The experimental data indicates that in 1996 about 5% of the absorbed solar radiation flux is not re-emitted as infrared radiation.Ā The net absorbed power corresponded to a 0.036 degree C per year rise in average ocean temperature about 20 years ago.Ā The corresponding IR flux not emitted is about 12 W / m^2.
I am the first to admit that due to various unavoidable measurement errors this number could easily be anywhere in the range 10 W / m^2 to 14 W / m^2.
I remind readers that tremendous amounts of heat have been absorbed by melting of ice in the Canadian and Russian arctic regions.Ā It is necessary to account for the latent heat of fusion that has melted sufficient ice to triple the rate of ocean level rise during my lifetime.Ā In this respect I remind readers that the deep ocean is mostly at about 4 degrees C at which temperature the thermal coefficient of expansion of water is zero.
ĀThat said let us examine the Mars Global Surveyor measurements in more detail.
The space craft was sufficiently distant that it could see an entire hemisphere.Ā It was moving in the plane of an Earth-Mars transfer orbit, which plane is close to Earth's orbital plane.Ā It was headed toward the sun while on a slingshot path to Mars. The issues that need to be addressed are:
1) The accuracy of the emission temperature determination;
2) The accuracy of the emissivity determination;
3) Possible error due to non-symetry in Earth IR emissions;
4) Possible error due to rotation of Earth (day-night effect).
The spacecraft had 6 redundant IR channels.Ā Some channels indicated a temperature of 270.8 K.Ā One channel had lower noise than the other channels and indicated 270.0 K. That was the data that the authors chose to publish.ĀĀ I do not know what was in the author's minds in making this choice.
I speculate that the noise was not present during electronics package testing, which would have occurred during the early 1990s.Ā The noise may have developed as a result of energetic particle bombardment of the electronics as the spacecraft went around the sun.Ā Hence I cannot fault the authors for choosing the lowest noise channel.Ā However, we should be cognizant that the 270 K might really be as much as 270.8 K.
Assuming that the IR channel choice is correct I do not think that the actual temperature could be either below 269 K or above 271 K as I have tried fitting various Planck curves to the experimental data and 270 K is definitely the best fit outside the GHG absorption bands.Ā In summary I think that there is a very high probability that the actual emission temperature seen by the space craft was in the range 270 K to 270.8 K.Ā My gut experience points to 270 K but I could be wrong in that respect.Ā If the true temperature was 270.8 K it would account for 1.1% out of the 5% net heat accumulation.
With respect to calculation of the Ft value I had the advantage of possession of original pre-publication data so I did not have to rely on picking up data points from the published paper.Ā Assuming that the IR sensor was completely linear I am confident that the calculation of emissivity is accurate to better than +/- 1%.
With respect to the other two issues I need to do some more homework.Ā However, I doubt that either of them will change the conclusion that Earth is absorbing heat dangerously quickly.
If due to the space craft being on the illuminated side of Earth the measured temperature was too high the effect is to make the rate of net heat absorption even higher than indicated by my initial calculation.
With respect to the Ceres data if we assume that the spacecraft measured a temperature too high due to more IR emission at lower latitudes than at high latitudes again the net effect is to make the net absorbed heat even higher than indicated by my initial calculation.
To me the data indicates that Earth has a very serious heat accumulation problem.Ā It appears that it may already be very late in terms of halting spontaneous thermal runaway by reducing CO2 emissions.Ā I doubt that the exact scale of this net heat accumulation problem can be accurately evaluated without further work to precisely measure Earth's Bond albedo as a function of time and Earth's emissivity as a function of time.
Accurate measurement of the Bond albedo is a multi-million dollar exercise.
Accurate measurement of Earth's emissivity in the manner used by the Mars Gobal Surveyor is a multi-billion dollar exercise. However, one of the advantages of the Mars Global Surveyor data analysis methodology is that it avoids the necessity for an absolute radiometer calibration.
I think that from the perspective of the required trillion dollar energy system decisions the astrophysical route will take too long. What we might reasonably do is compare accurate measurements of deep ocean temperature made 20+ years ago to recent measurements of deep ocean temperature.Ā If this data indicates heat accumulation in the deep ocean to the extent indicated by the astrophysical data then this whole matter should be drawn to the attention of senior persons at NASA, the Russian Space Agency,Ā the European Space agency and the Chinese space agency as those are the parties who could reasonably pursue further astrophysical measurements.
ĀFor now we need to obtain reliable deep ocean temperature data where ever it exists. In this respect there may be relevant Argo data, US navy data, Russian navy data and perhaps UK navy data.
We may need to talk to the parties that located the Titanic and find if they have any accurate deep water temperature data from that period.Ā If so, such data would reference a known fixed location.ĀĀ Ideally we need many accurate deep ocean fixed location data points.
ĀIt may be that the Argo buoys do not go deep enough or do not have the long term absolute accuracy and stability to provide a really definitive answer.Ā I have some experience with precision measurement of liquid temperatures for heat metering and equipment efficiency measurement in major buildings.Ā One of the challenges that we have is that most temperature measurement equipment lacks the required combined absolute accuracy and long term stability.
PROGNOSIS:
The theoretical analysis contained herein indicates that thermal runaway will cause a 15 deg K to 19 deg K increase in average Earth emission temperature. Earth will likely be trapped in the "warm" state for several hundred thousand years.
The geologic record contains multiple sustained step changes in temperature of about 15 degrees C. Each of the sustained high temperature excursions caused melting of the polar icecaps.
Fundamentally most voters do not understand the phenomena of thermal runaway described in this document. There is little understanding, even in the scientific and engineering community, of the immediacy of the problem. There are three major related issues.
The first issue is understanding the physics that leads to thermal runaway.
The second issue is grasping that today we are facing a spontaneous average emission temperature increase of about 17.7 degrees C. The rate of this temperature increase will be moderated by the heat capacity of the oceans. However, absent immediate and sufficient corrective action this spontaneous temperature increase will occur during the next two centuries.
The third major issue is grasping that prevention of thermal runaway requires immediate world wide abandonment of use of fossil carbon and immediate world wide adoption of sustainable non-fossil energy and construction material technologies. Under the best of circumstances implementation of the necessary energy system and construction material changes will likely take at least 50 years.
The fourth major issue is grasping that in order to meet the time constraints major corrective action must be commenced now. The residence time of excess CO2 in the atmosphere by itself introduces a delay of about 16 years.
This web page last updated December 27, 2019.
| Home | Energy Physics | Nuclear Power | Electricity | Climate Change | Lighting Control | Contacts | Links |
|---|